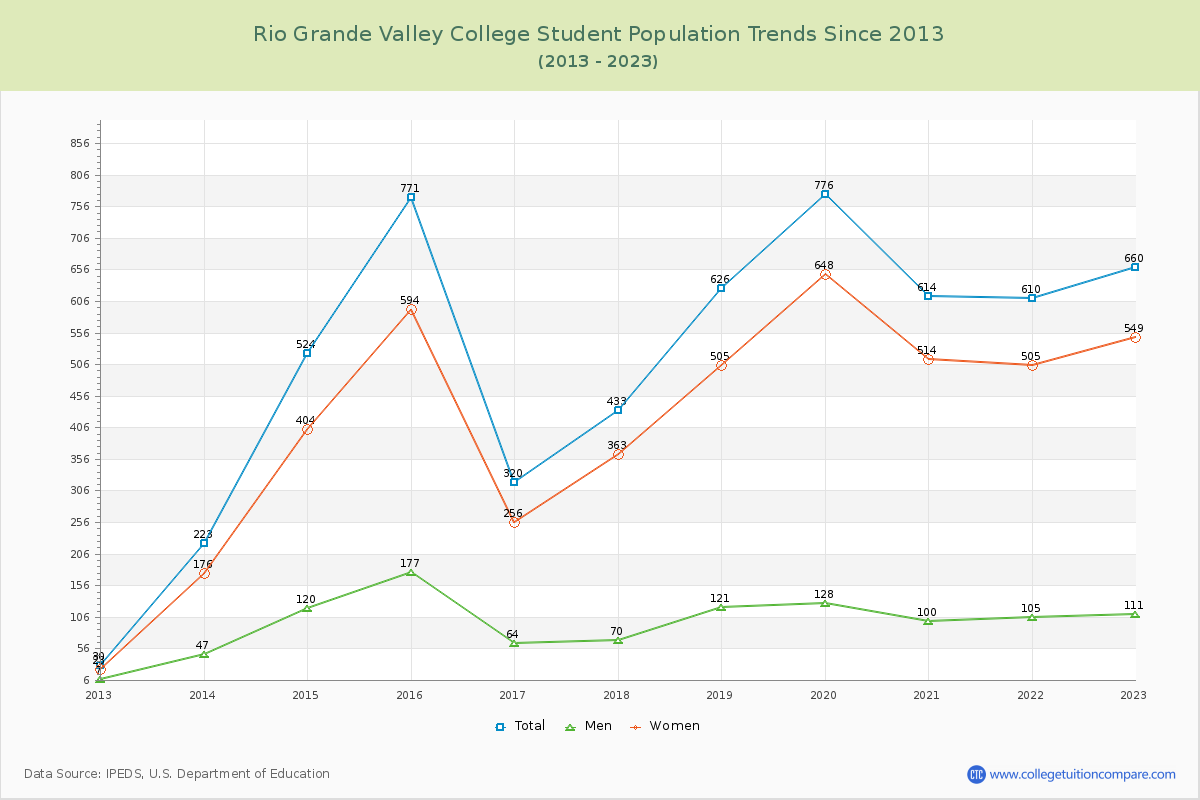
Student Population Changes
The average student population over the last 12 years is 508 where 660 students are attending the school for the academic year 2022-2023.
The female to male ratio is 4.95 to 1 and it means that there are far more female students enrolled in Rio Grande Valley than male students.
The following table and chart illustrate the changes in student population by gender at Rio Grande Valley College since 2012.
| Year | Total | Men | Women |
|---|---|---|---|
| 2012-13 | 30 | 7 | 23 |
| 2013-14 | 223 193 | 47 40 | 176 153 |
| 2014-15 | 524 301 | 120 73 | 404 228 |
| 2015-16 | 771 247 | 177 57 | 594 190 |
| 2016-17 | 320 -451 | 64 -113 | 256 -338 |
| 2017-18 | 433 113 | 70 6 | 363 107 |
| 2018-19 | 626 193 | 121 51 | 505 142 |
| 2019-20 | 776 150 | 128 7 | 648 143 |
| 2020-21 | 614 -162 | 100 -28 | 514 -134 |
| 2021-22 | 610 -4 | 105 5 | 505 -9 |
| 2022-23 | 660 50 | 111 6 | 549 44 |
| Average | 508 | 95 | 412 |