Student Population Changes
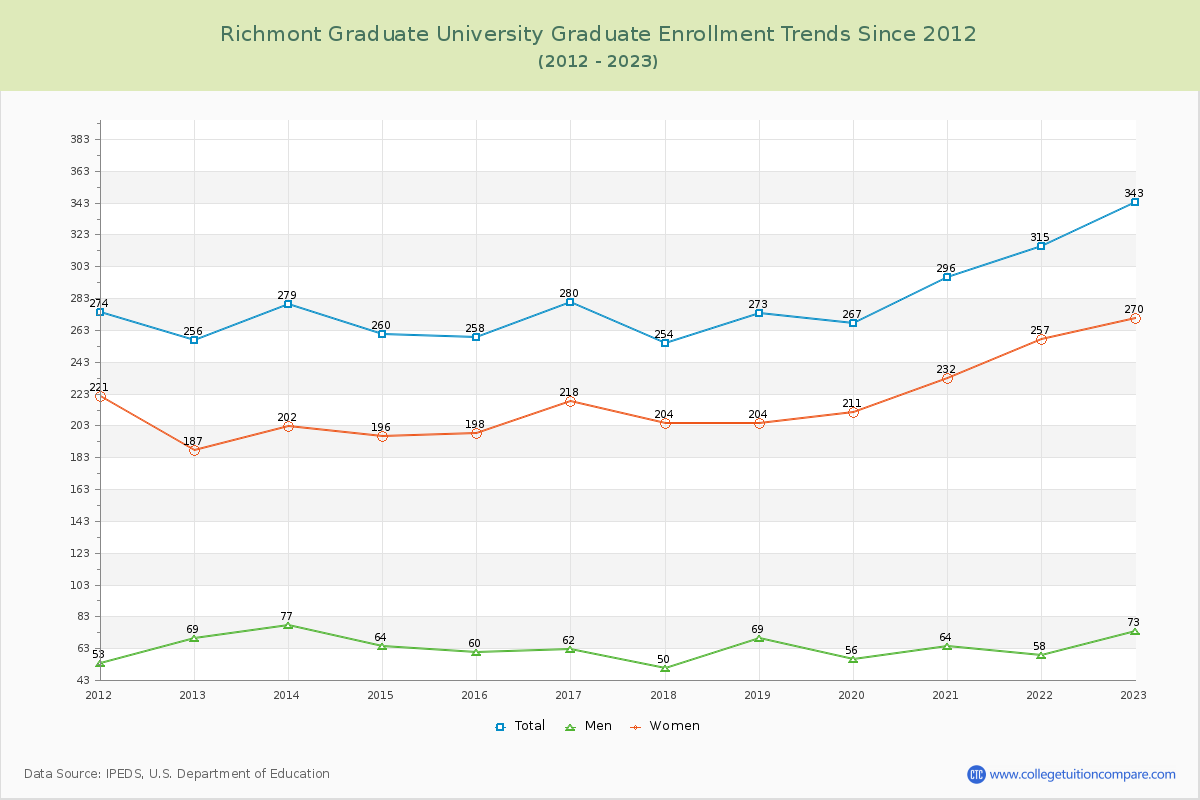
The average student population over the last 12 years is 280 where 343 students are attending the school for the academic year 2022-2023.
The female to male ratio is 3.70 to 1 and it means that there are far more female students enrolled in Richmont Graduate than male students.
The following table and chart illustrate the changes in student population by gender at Richmont Graduate University since 2012.
| Year | Total | Men | Women |
|---|---|---|---|
| 2012-13 | 256 | 69 | 187 |
| 2013-14 | 279 23 | 77 8 | 202 15 |
| 2014-15 | 260 -19 | 64 -13 | 196 -6 |
| 2015-16 | 258 -2 | 60 -4 | 198 2 |
| 2016-17 | 280 22 | 62 2 | 218 20 |
| 2017-18 | 254 -26 | 50 -12 | 204 -14 |
| 2018-19 | 273 19 | 69 19 | 204 0 |
| 2019-20 | 267 -6 | 56 -13 | 211 7 |
| 2020-21 | 296 29 | 64 8 | 232 21 |
| 2021-22 | 315 19 | 58 -6 | 257 25 |
| 2022-23 | 343 28 | 73 15 | 270 13 |
| Average | 280 | 64 | 216 |