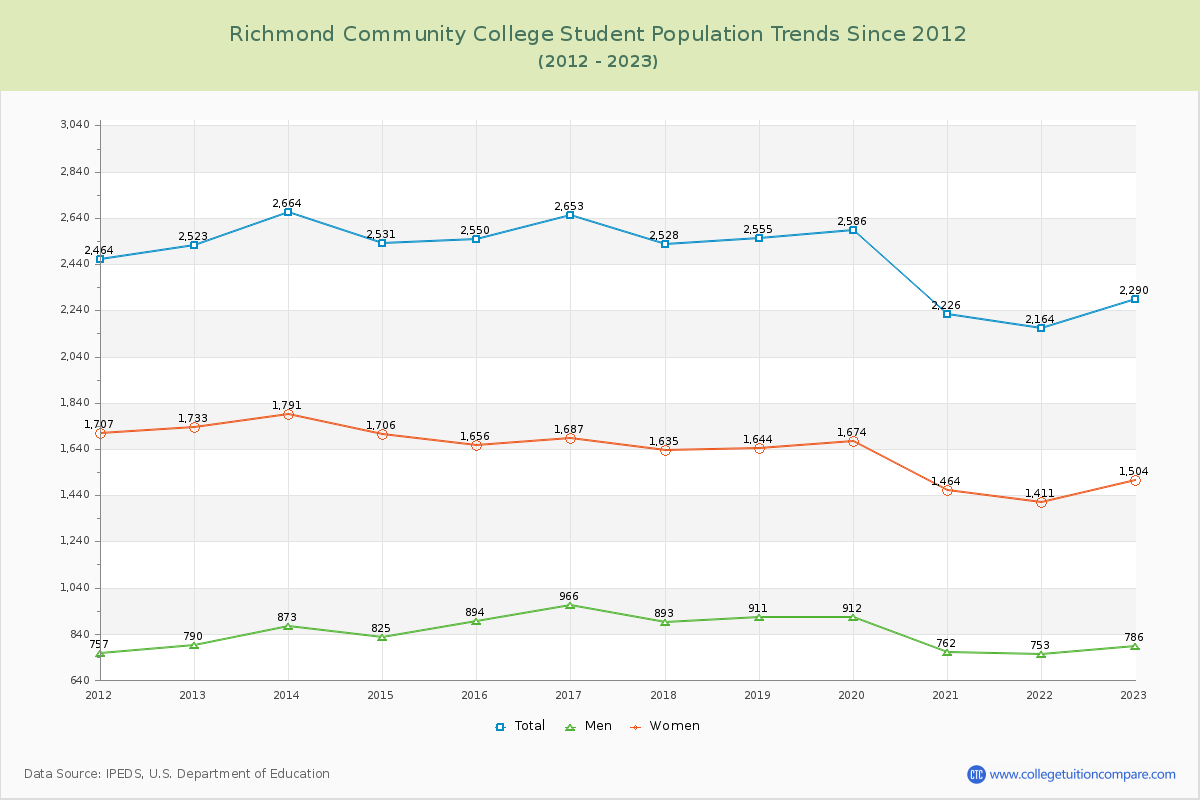
Student Population Changes
The average student population over the last 12 years is 2,479 where 2,290 students are attending the school for the academic year 2022-2023.
The female to male ratio is 1.91 to 1 and it means that there are more female students enrolled in Richmond CC than male students.
The following table and chart illustrate the changes in student population by gender at Richmond Community College since 2012.
| Year | Total | Men | Women |
|---|---|---|---|
| 2012-13 | 2,523 | 790 | 1,733 |
| 2013-14 | 2,664 141 | 873 83 | 1,791 58 |
| 2014-15 | 2,531 -133 | 825 -48 | 1,706 -85 |
| 2015-16 | 2,550 19 | 894 69 | 1,656 -50 |
| 2016-17 | 2,653 103 | 966 72 | 1,687 31 |
| 2017-18 | 2,528 -125 | 893 -73 | 1,635 -52 |
| 2018-19 | 2,555 27 | 911 18 | 1,644 9 |
| 2019-20 | 2,586 31 | 912 1 | 1,674 30 |
| 2020-21 | 2,226 -360 | 762 -150 | 1,464 -210 |
| 2021-22 | 2,164 -62 | 753 -9 | 1,411 -53 |
| 2022-23 | 2,290 126 | 786 33 | 1,504 93 |
| Average | 2,479 | 851 | 1,628 |