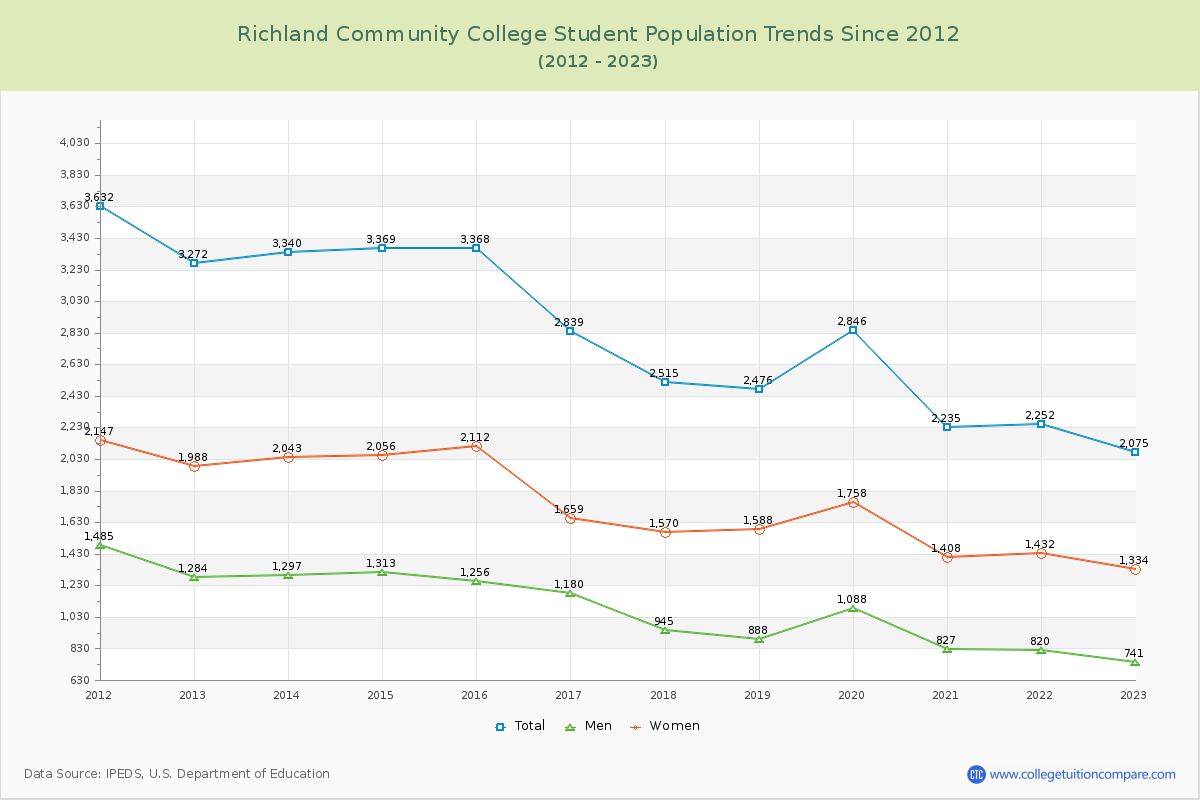
Student Population Changes
The average student population over the last 12 years is 2,781 where 2,075 students are attending the school for the academic year 2022-2023.
The female to male ratio is 1.80 to 1 and it means that there are more female students enrolled in Richland CC than male students.
The following table and chart illustrate the changes in student population by gender at Richland Community College since 2012.
| Year | Total | Men | Women |
|---|---|---|---|
| 2012-13 | 3,272 | 1,284 | 1,988 |
| 2013-14 | 3,340 68 | 1,297 13 | 2,043 55 |
| 2014-15 | 3,369 29 | 1,313 16 | 2,056 13 |
| 2015-16 | 3,368 -1 | 1,256 -57 | 2,112 56 |
| 2016-17 | 2,839 -529 | 1,180 -76 | 1,659 -453 |
| 2017-18 | 2,515 -324 | 945 -235 | 1,570 -89 |
| 2018-19 | 2,476 -39 | 888 -57 | 1,588 18 |
| 2019-20 | 2,846 370 | 1,088 200 | 1,758 170 |
| 2020-21 | 2,235 -611 | 827 -261 | 1,408 -350 |
| 2021-22 | 2,252 17 | 820 -7 | 1,432 24 |
| 2022-23 | 2,075 -177 | 741 -79 | 1,334 -98 |
| Average | 2,781 | 1,058 | 1,723 |