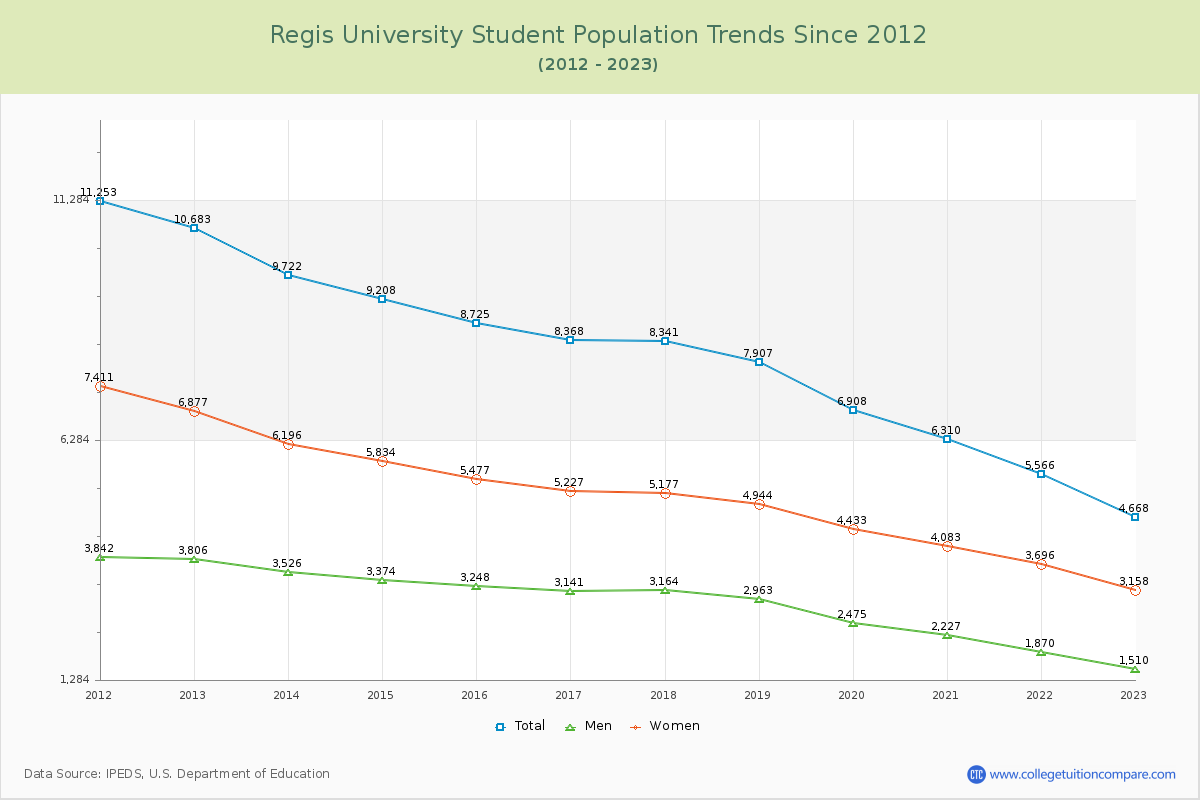
Student Population Changes
The average student population over the last 12 years is 7,855 where 4,668 students are attending the school for the academic year 2022-2023.
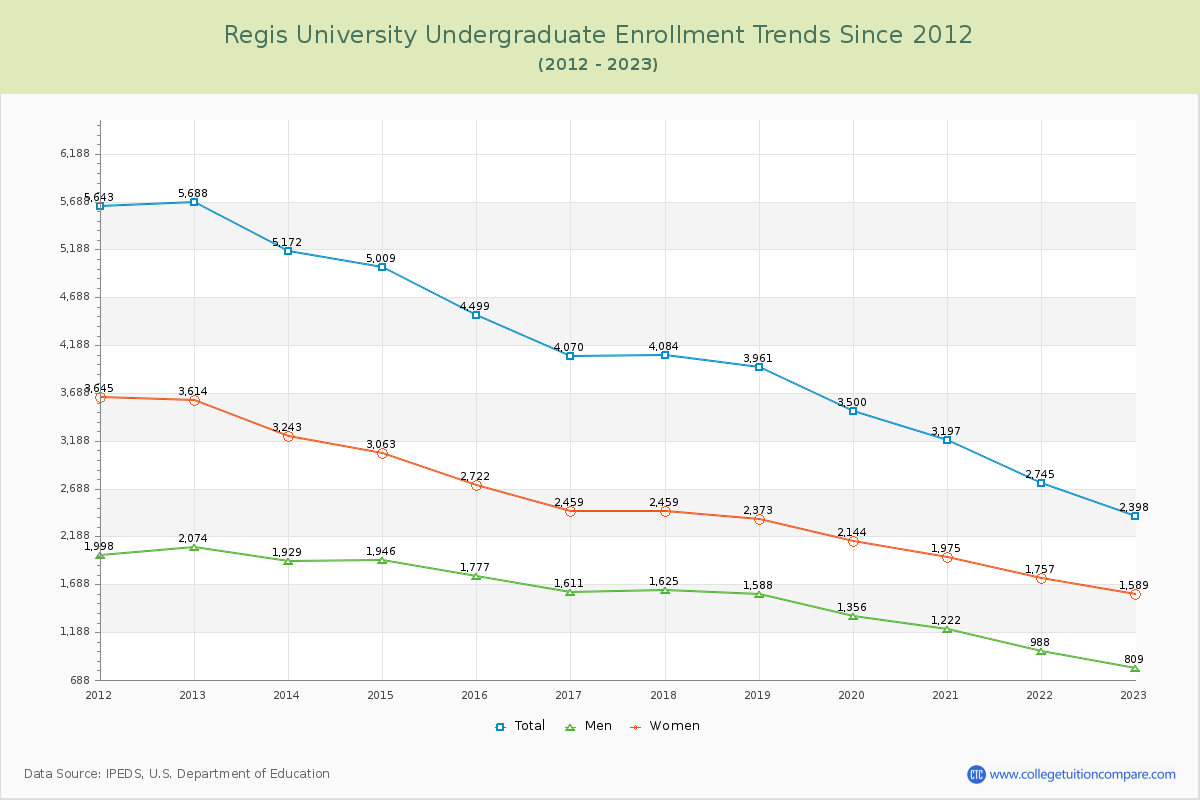
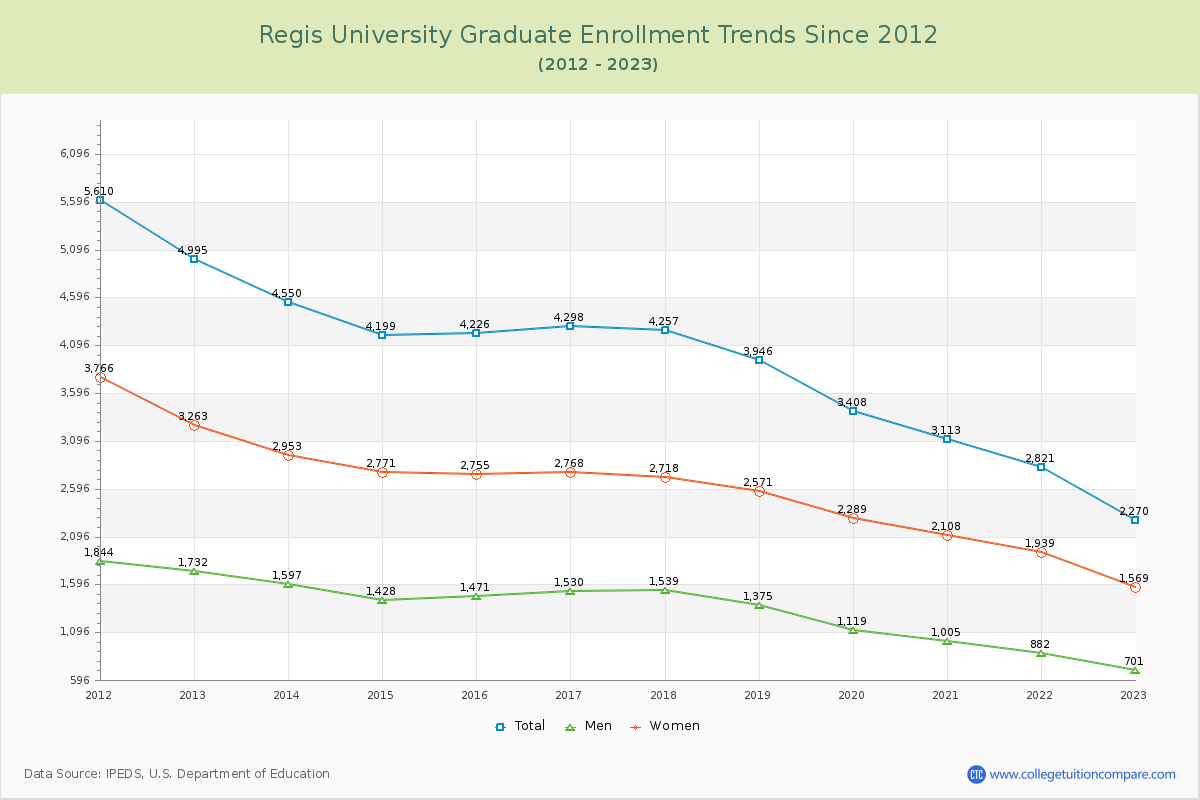
51.37% of total students is undergraduate students and 48.63% students is graduate students. The number of undergraduate students has decreased by 3,290 and the graduate enrollment has decreased by 2,725 over past 10 years.
The female to male ratio is 2.09 to 1 and it means that there are far more female students enrolled in Regis than male students.
The following table and chart illustrate the changes in student population by gender at Regis University since 2012.
| Year | Total | Undergraduate | Graduate | ||||
|---|---|---|---|---|---|---|---|
| Total | Men | Women | Total | Men | Women | ||
| 2012-13 | 10,683 | 5,688 | 2,074 | 3,614 | 4,995 | 1,732 | 3,263 |
| 2013-14 | 9,722 -961 | 5,172 -516 | 1,929 -145 | 3,243 -371 | 4,550 -445 | 1,597 -135 | 2,953 -310 |
| 2014-15 | 9,208 -514 | 5,009 -163 | 1,946 17 | 3,063 -180 | 4,199 -351 | 1,428 -169 | 2,771 -182 |
| 2015-16 | 8,725 -483 | 4,499 -510 | 1,777 -169 | 2,722 -341 | 4,226 27 | 1,471 43 | 2,755 -16 |
| 2016-17 | 8,368 -357 | 4,070 -429 | 1,611 -166 | 2,459 -263 | 4,298 72 | 1,530 59 | 2,768 13 |
| 2017-18 | 8,341 -27 | 4,084 14 | 1,625 14 | 2,459 0 | 4,257 -41 | 1,539 9 | 2,718 -50 |
| 2018-19 | 7,907 -434 | 3,961 -123 | 1,588 -37 | 2,373 -86 | 3,946 -311 | 1,375 -164 | 2,571 -147 |
| 2019-20 | 6,908 -999 | 3,500 -461 | 1,356 -232 | 2,144 -229 | 3,408 -538 | 1,119 -256 | 2,289 -282 |
| 2020-21 | 6,310 -598 | 3,197 -303 | 1,222 -134 | 1,975 -169 | 3,113 -295 | 1,005 -114 | 2,108 -181 |
| 2021-22 | 5,566 -744 | 2,745 -452 | 988 -234 | 1,757 -218 | 2,821 -292 | 882 -123 | 1,939 -169 |
| 2022-23 | 4,668 -898 | 2,398 -347 | 809 -179 | 1,589 -168 | 2,270 -551 | 701 -181 | 1,569 -370 |
| Average | 7,855 | 4,029 | 1,539 | 2,491 | 3,826 | 1,307 | 2,519 |