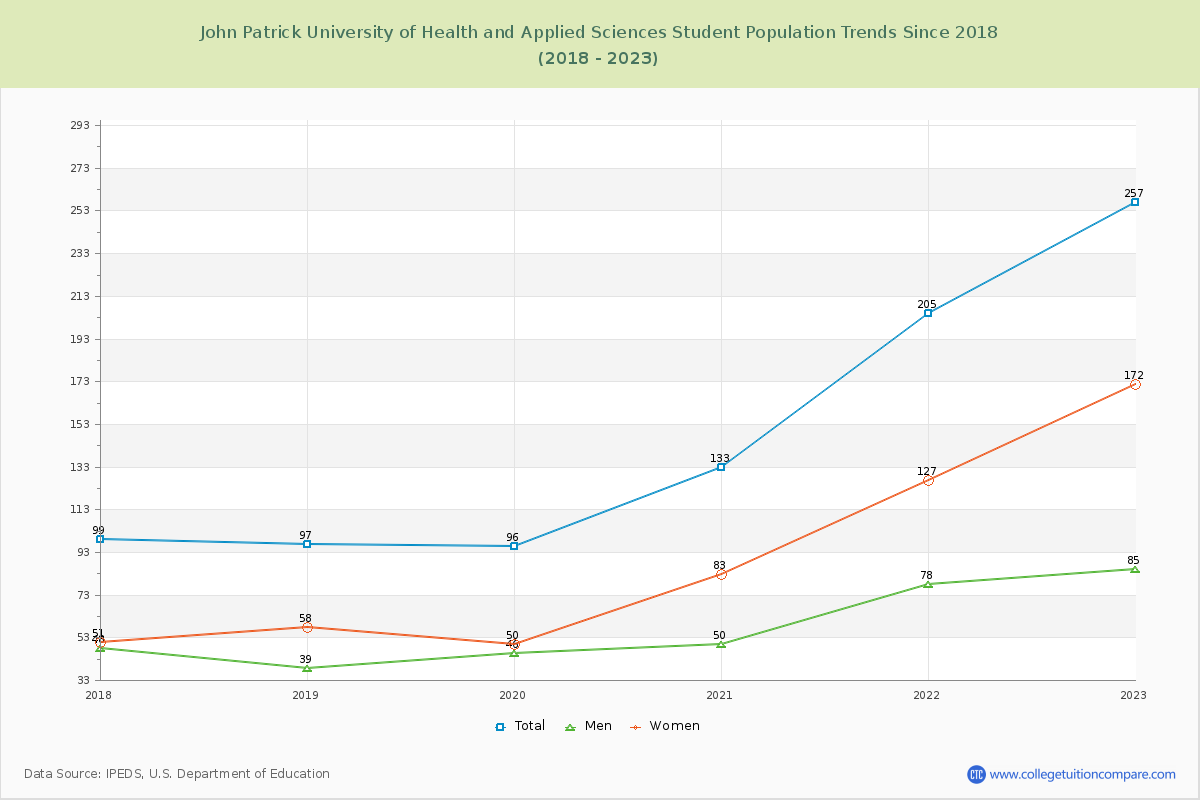
Student Population Changes
The average student population over the last 7 years is 148 where 257 students are attending the school for the academic year 2022-2023.
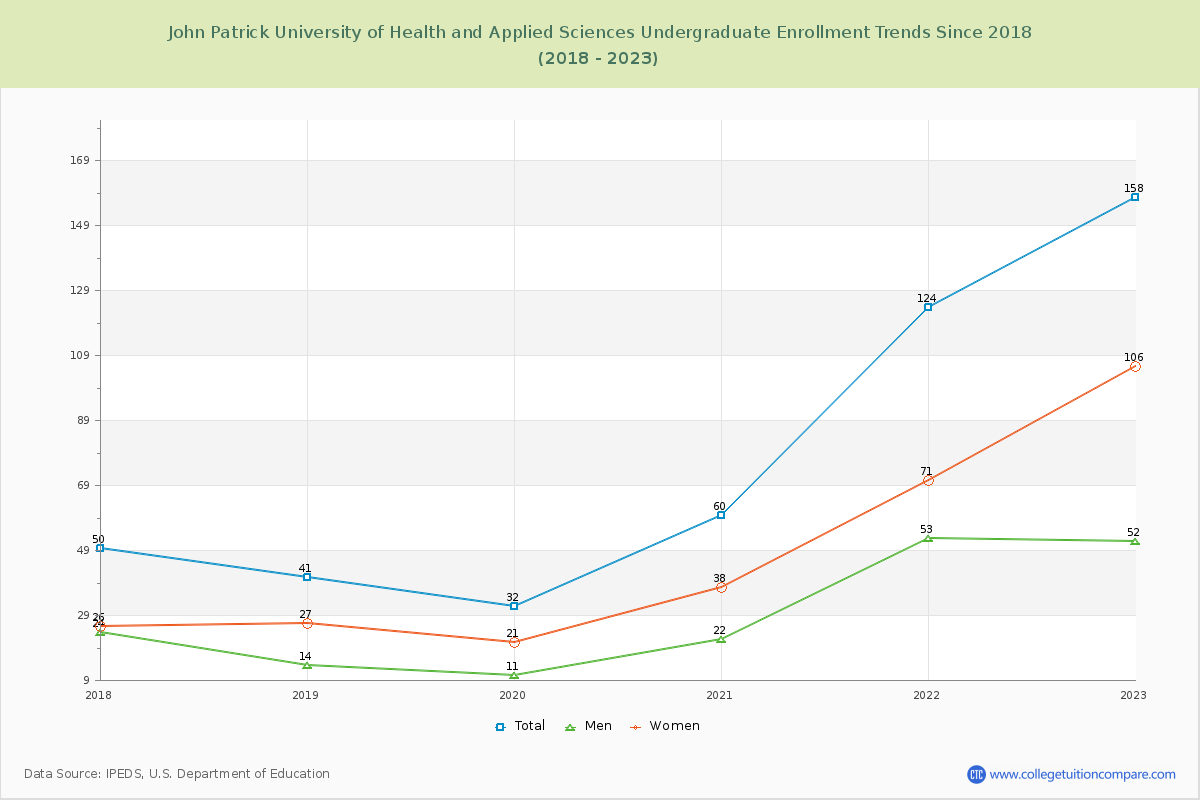
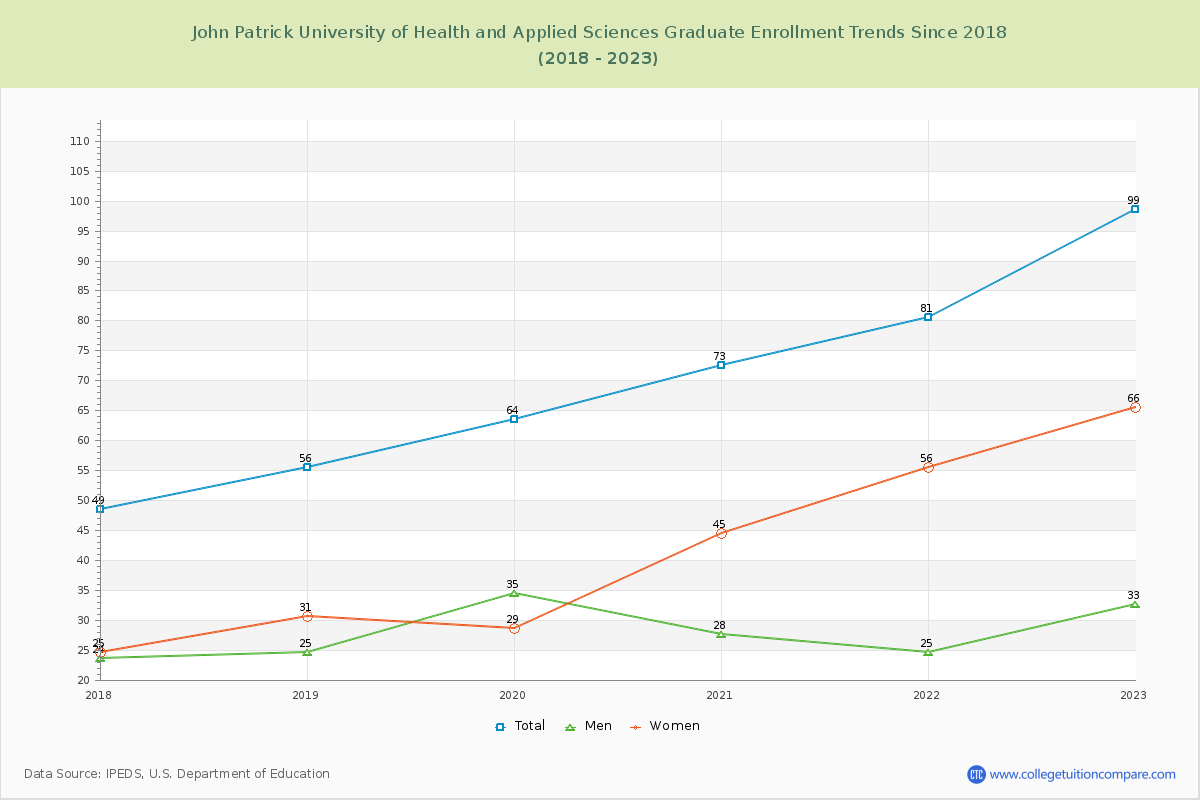
61.48% of total students is undergraduate students and 38.52% students is graduate students. The number of undergraduate students has increased by 108 and the graduate enrollment has increased by 50 over past 10 years.
The female to male ratio is 2.02 to 1 and it means that there are far more female students enrolled in John Patrick University of Health and Applied Sciences than male students.
The following table and chart illustrate the changes in student population by gender at John Patrick University of Health and Applied Sciences since 2017.
| Year | Total | Undergraduate | Graduate | ||||
|---|---|---|---|---|---|---|---|
| Total | Men | Women | Total | Men | Women | ||
| 2017-18 | 99 | 50 | 24 | 26 | 49 | 24 | 25 |
| 2018-19 | 97 -2 | 41 -9 | 14 -10 | 27 1 | 56 7 | 25 1 | 31 6 |
| 2019-20 | 96 -1 | 32 -9 | 11 -3 | 21 -6 | 64 8 | 35 10 | 29 -2 |
| 2020-21 | 133 37 | 60 28 | 22 11 | 38 17 | 73 9 | 28 -7 | 45 16 |
| 2021-22 | 205 72 | 124 64 | 53 31 | 71 33 | 81 8 | 25 -3 | 56 11 |
| 2022-23 | 257 52 | 158 34 | 52 -1 | 106 35 | 99 18 | 33 8 | 66 10 |
| Average | 148 | 78 | 29 | 48 | 70 | 28 | 42 |