Student Population Changes
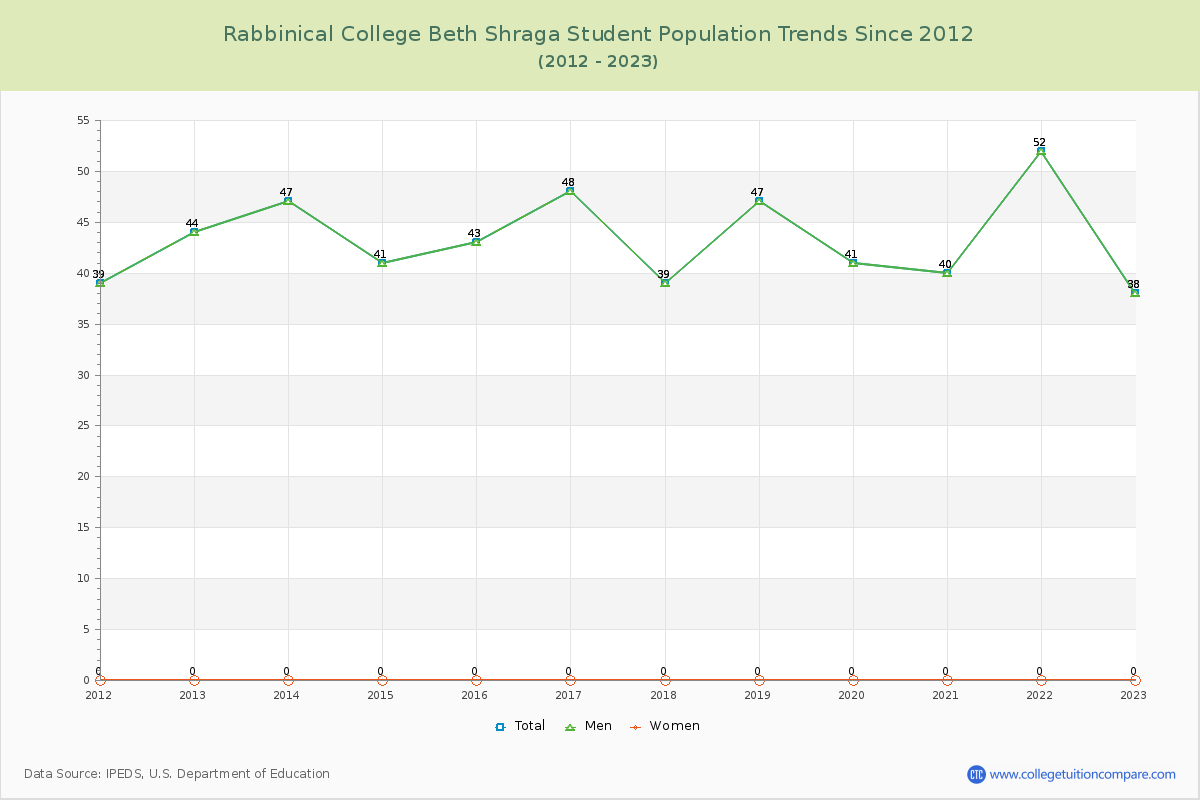
The average student population over the last 12 years is 44 where 38 students are attending the school for the academic year 2022-2023.
The following table and chart illustrate the changes in student population by gender at Rabbinical College Beth Shraga since 2012.
| Year | Total | Men | Women |
|---|---|---|---|
| 2012-13 | 44 | 44 | 0 |
| 2013-14 | 47 3 | 47 3 | 0 0 |
| 2014-15 | 41 -6 | 41 -6 | 0 0 |
| 2015-16 | 43 2 | 43 2 | 0 0 |
| 2016-17 | 48 5 | 48 5 | 0 0 |
| 2017-18 | 39 -9 | 39 -9 | 0 0 |
| 2018-19 | 47 8 | 47 8 | 0 0 |
| 2019-20 | 41 -6 | 41 -6 | 0 0 |
| 2020-21 | 40 -1 | 40 -1 | 0 0 |
| 2021-22 | 52 12 | 52 12 | 0 0 |
| 2022-23 | 38 -14 | 38 -14 | 0 0 |
| Average | 44 | 44 | 0 |