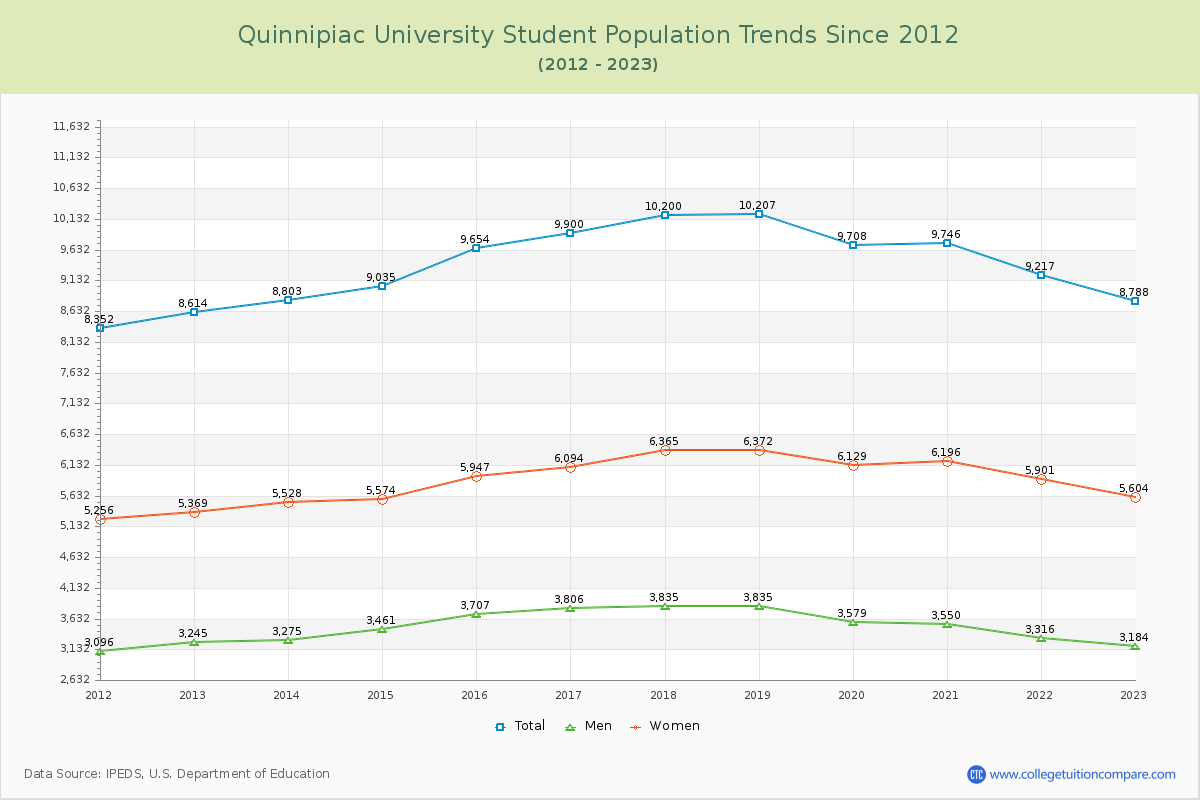
Student Population Changes
The average student population over the last 12 years is 9,443 where 8,788 students are attending the school for the academic year 2022-2023.
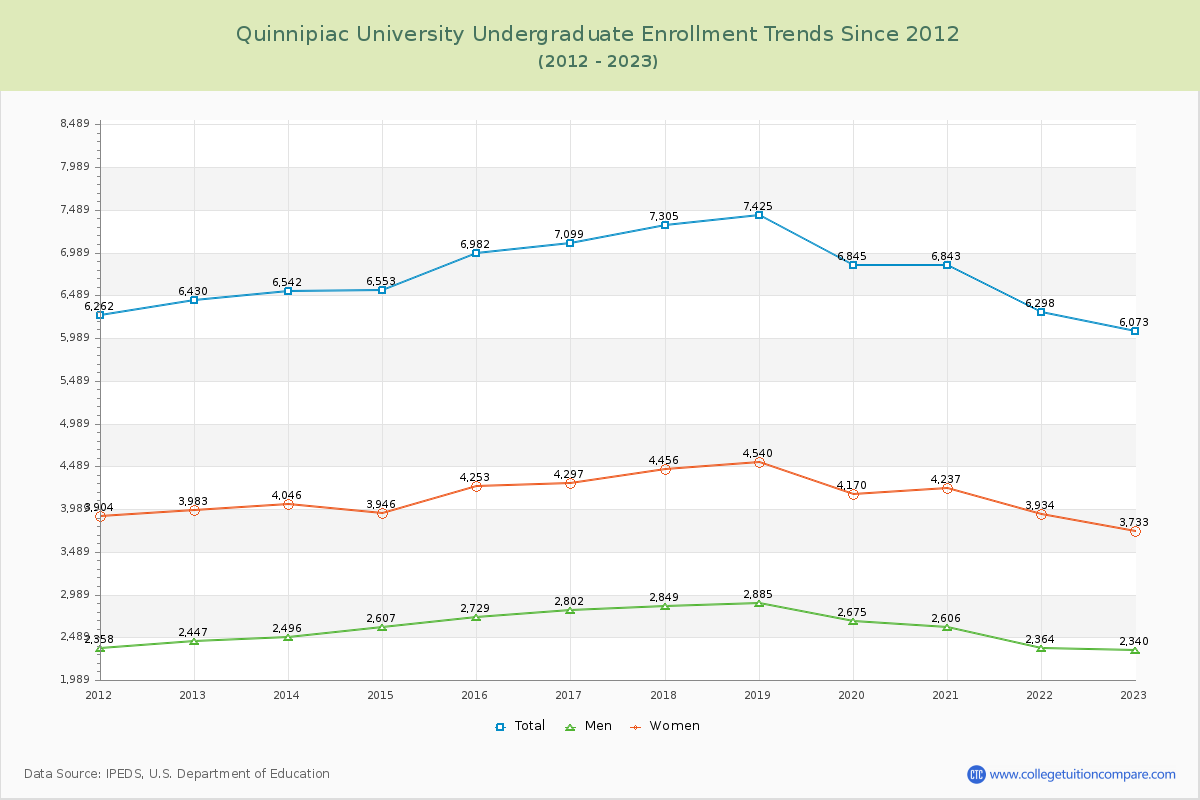
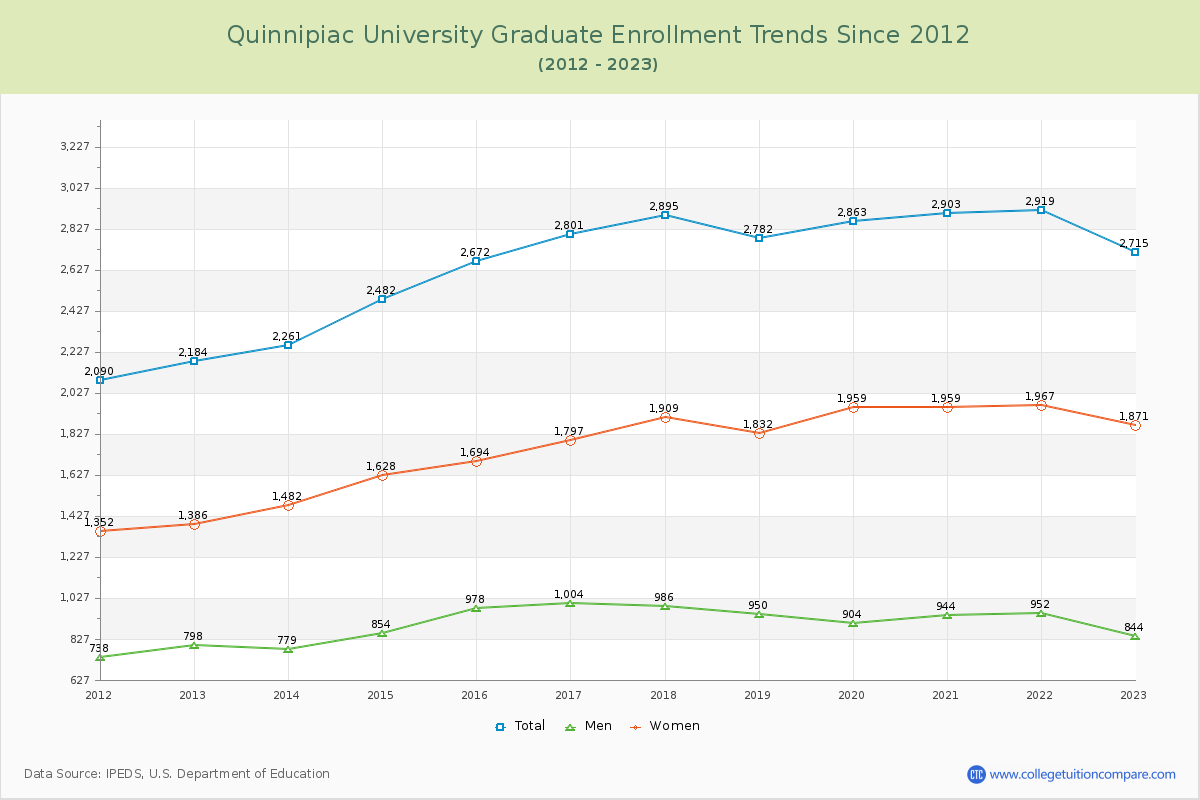
69.11% of total students is undergraduate students and 30.89% students is graduate students. The number of undergraduate students has decreased by 357 and the graduate enrollment has increased by 531 over past 10 years.
The female to male ratio is 1.76 to 1 and it means that there are more female students enrolled in Quinnipiac than male students.
The following table and chart illustrate the changes in student population by gender at Quinnipiac University since 2012.
| Year | Total | Undergraduate | Graduate | ||||
|---|---|---|---|---|---|---|---|
| Total | Men | Women | Total | Men | Women | ||
| 2012-13 | 8,614 | 6,430 | 2,447 | 3,983 | 2,184 | 798 | 1,386 |
| 2013-14 | 8,803 189 | 6,542 112 | 2,496 49 | 4,046 63 | 2,261 77 | 779 -19 | 1,482 96 |
| 2014-15 | 9,035 232 | 6,553 11 | 2,607 111 | 3,946 -100 | 2,482 221 | 854 75 | 1,628 146 |
| 2015-16 | 9,654 619 | 6,982 429 | 2,729 122 | 4,253 307 | 2,672 190 | 978 124 | 1,694 66 |
| 2016-17 | 9,900 246 | 7,099 117 | 2,802 73 | 4,297 44 | 2,801 129 | 1,004 26 | 1,797 103 |
| 2017-18 | 10,200 300 | 7,305 206 | 2,849 47 | 4,456 159 | 2,895 94 | 986 -18 | 1,909 112 |
| 2018-19 | 10,207 7 | 7,425 120 | 2,885 36 | 4,540 84 | 2,782 -113 | 950 -36 | 1,832 -77 |
| 2019-20 | 9,708 -499 | 6,845 -580 | 2,675 -210 | 4,170 -370 | 2,863 81 | 904 -46 | 1,959 127 |
| 2020-21 | 9,746 38 | 6,843 -2 | 2,606 -69 | 4,237 67 | 2,903 40 | 944 40 | 1,959 0 |
| 2021-22 | 9,217 -529 | 6,298 -545 | 2,364 -242 | 3,934 -303 | 2,919 16 | 952 8 | 1,967 8 |
| 2022-23 | 8,788 -429 | 6,073 -225 | 2,340 -24 | 3,733 -201 | 2,715 -204 | 844 -108 | 1,871 -96 |
| Average | 9,443 | 6,763 | 2,618 | 4,145 | 2,680 | 908 | 1,771 |