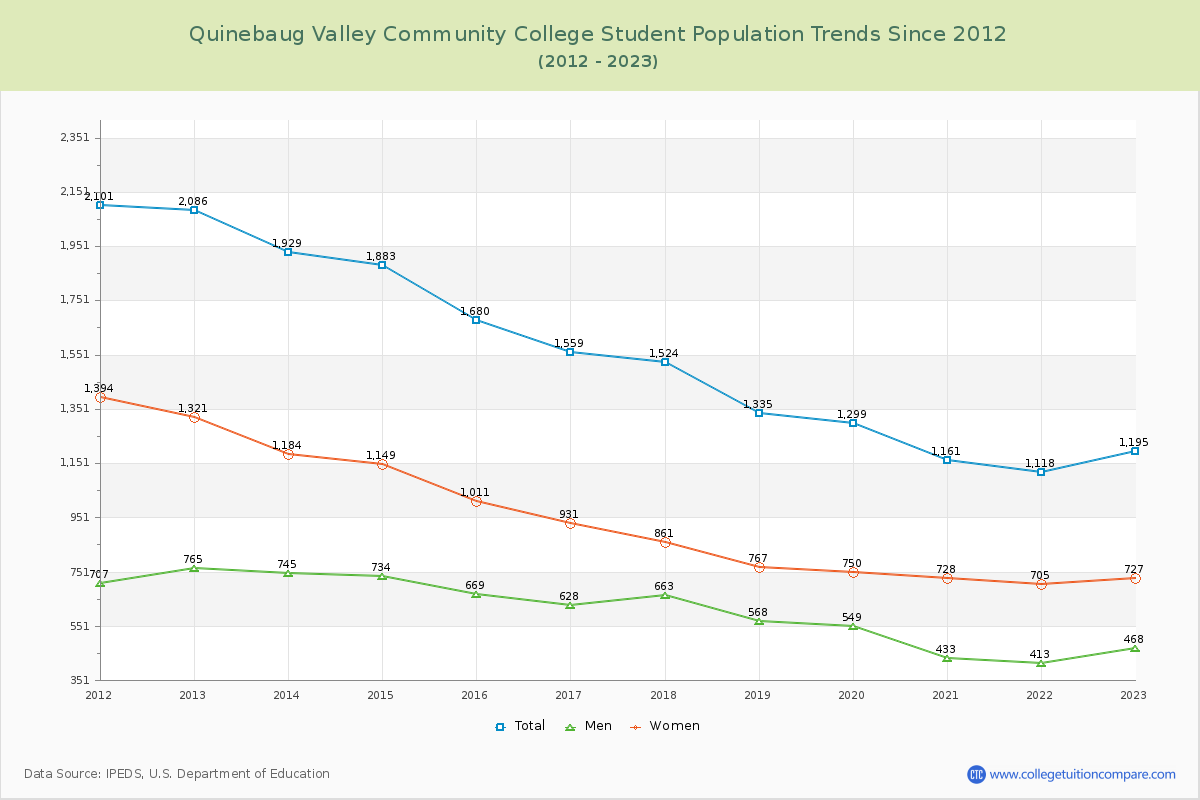
Student Population Changes
The average student population over the last 12 years is 1,524 where 1,195 students are attending the school for the academic year 2022-2023.
The female to male ratio is 1.55 to 1 and it means that there are more female students enrolled in QVCC than male students.
The following table and chart illustrate the changes in student population by gender at Quinebaug Valley Community College since 2012.
| Year | Total | Men | Women |
|---|---|---|---|
| 2012-13 | 2,086 | 765 | 1,321 |
| 2013-14 | 1,929 -157 | 745 -20 | 1,184 -137 |
| 2014-15 | 1,883 -46 | 734 -11 | 1,149 -35 |
| 2015-16 | 1,680 -203 | 669 -65 | 1,011 -138 |
| 2016-17 | 1,559 -121 | 628 -41 | 931 -80 |
| 2017-18 | 1,524 -35 | 663 35 | 861 -70 |
| 2018-19 | 1,335 -189 | 568 -95 | 767 -94 |
| 2019-20 | 1,299 -36 | 549 -19 | 750 -17 |
| 2020-21 | 1,161 -138 | 433 -116 | 728 -22 |
| 2021-22 | 1,118 -43 | 413 -20 | 705 -23 |
| 2022-23 | 1,195 77 | 468 55 | 727 22 |
| Average | 1,524 | 603 | 921 |