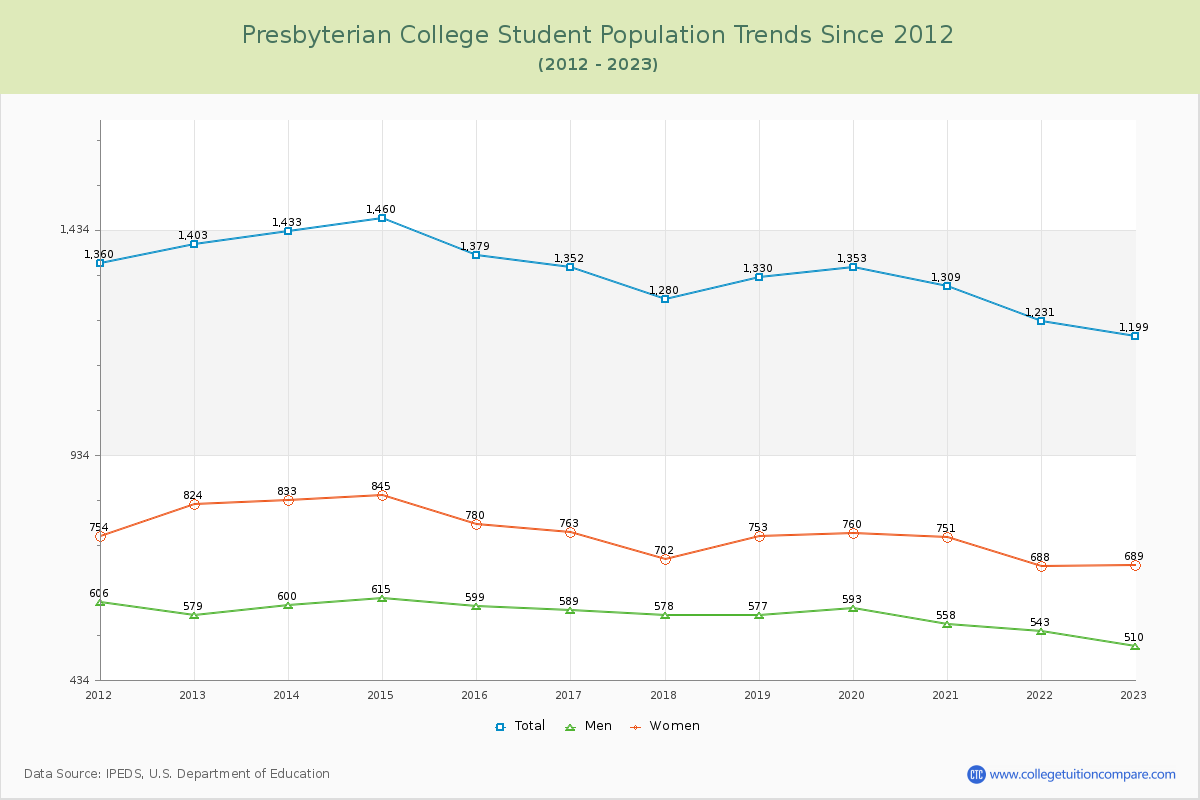
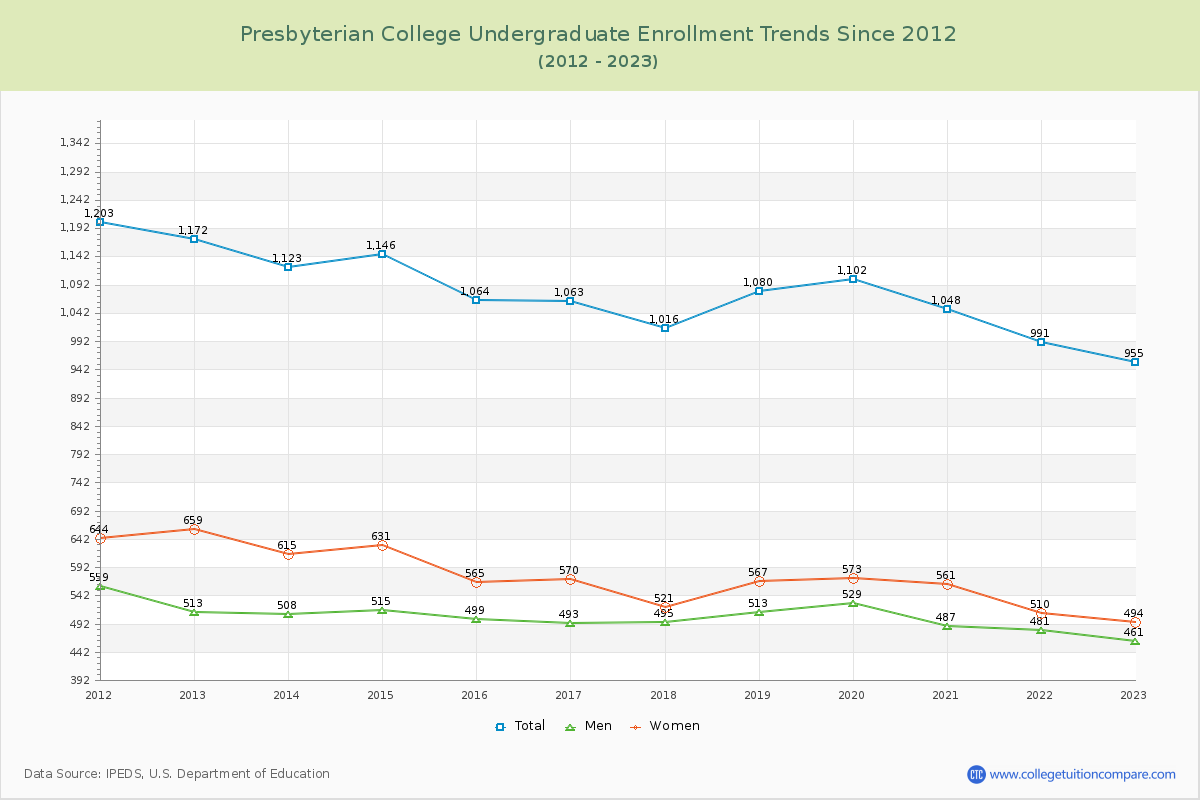
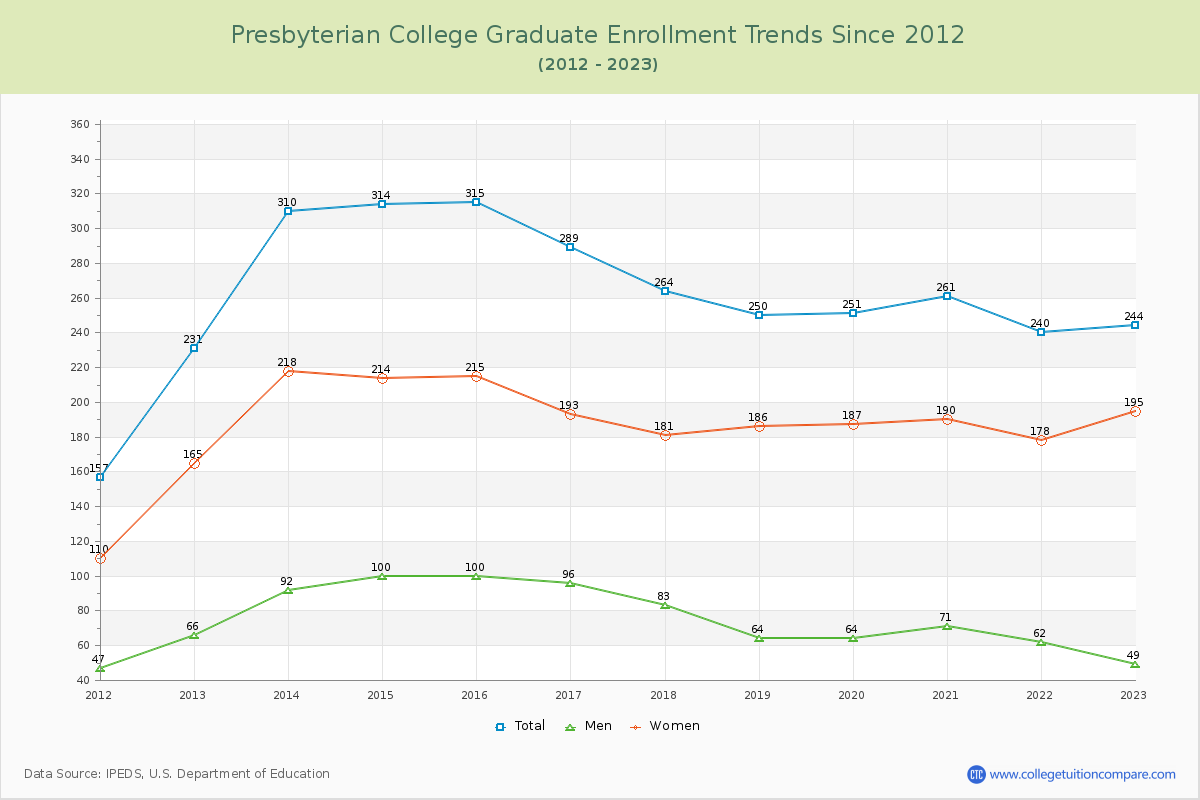
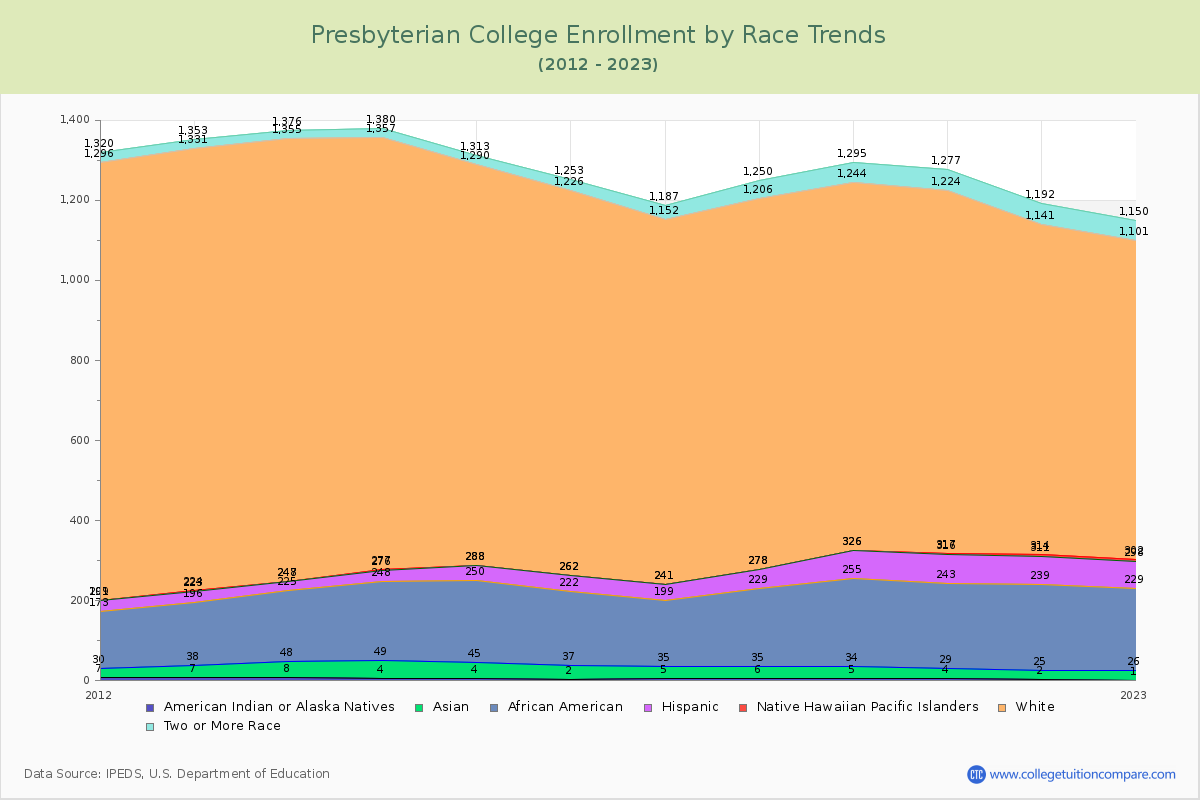
Student Population Changes
The average student population over the last 12 years is 1,339 where 1,199 students are attending the school for the academic year 2022-2023.
79.65% of total students is undergraduate students and 20.35% students is graduate students. The number of undergraduate students has decreased by 217 and the graduate enrollment has increased by 13 over past 10 years.
The female to male ratio is 1.35 to 1 and it means that there are more female students enrolled in PC than male students.
The following table and chart illustrate the changes in student population by gender at Presbyterian College since 2012.
| Year | Total | Undergraduate | Graduate | ||||
|---|---|---|---|---|---|---|---|
| Total | Men | Women | Total | Men | Women | ||
| 2012-13 | 1,403 | 1,172 | 513 | 659 | 231 | 66 | 165 |
| 2013-14 | 1,433 30 | 1,123 -49 | 508 -5 | 615 -44 | 310 79 | 92 26 | 218 53 |
| 2014-15 | 1,460 27 | 1,146 23 | 515 7 | 631 16 | 314 4 | 100 8 | 214 -4 |
| 2015-16 | 1,379 -81 | 1,064 -82 | 499 -16 | 565 -66 | 315 1 | 100 0 | 215 1 |
| 2016-17 | 1,352 -27 | 1,063 -1 | 493 -6 | 570 5 | 289 -26 | 96 -4 | 193 -22 |
| 2017-18 | 1,280 -72 | 1,016 -47 | 495 2 | 521 -49 | 264 -25 | 83 -13 | 181 -12 |
| 2018-19 | 1,330 50 | 1,080 64 | 513 18 | 567 46 | 250 -14 | 64 -19 | 186 5 |
| 2019-20 | 1,353 23 | 1,102 22 | 529 16 | 573 6 | 251 1 | 64 0 | 187 1 |
| 2020-21 | 1,309 -44 | 1,048 -54 | 487 -42 | 561 -12 | 261 10 | 71 7 | 190 3 |
| 2021-22 | 1,231 -78 | 991 -57 | 481 -6 | 510 -51 | 240 -21 | 62 -9 | 178 -12 |
| 2022-23 | 1,199 -32 | 955 -36 | 461 -20 | 494 -16 | 244 4 | 49 -13 | 195 17 |
| Average | 1,339 | 1,069 | 499 | 570 | 270 | 77 | 193 |