Enrollment Trends at Potomac State College of West Vi

-398

Total Enrollment

-261

Men

-137

Women

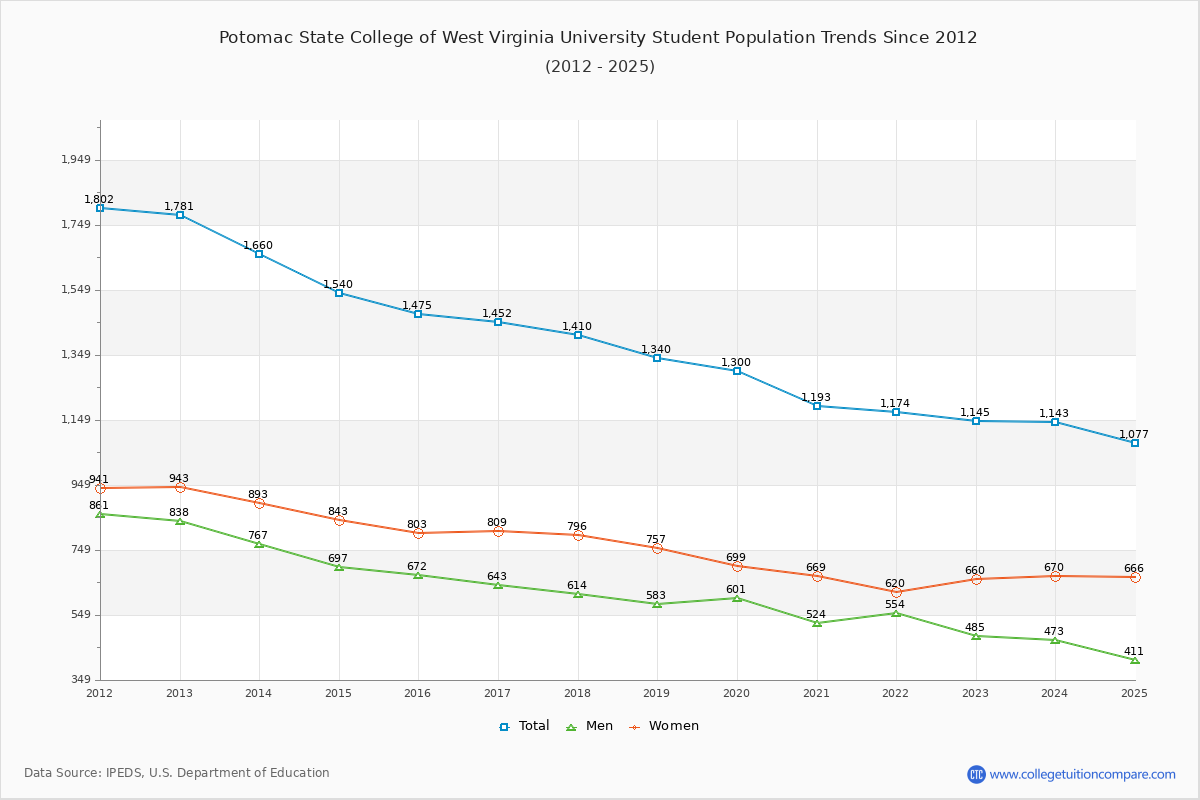
The student population at Potomac State College of West Virginia University is 1,077 (all undergraduate). The number of students has decreased by 398 over the past decade.

The female to male ratio is 1.62 to 1 which means that female students enrolled more than male students.

241 students enrolled in online degree program exclusively and the number of online students has increased by 653.13% since 2015.

Student Population Changes

The average student population over the last 11 years is 1,271 where 1,077 students are attending the school for the academic year 2024-2025.

The female to male ratio is 1.62 to 1 and it means that there are more female students enrolled in Potomac State College of West Vi than male students.

The following table and chart illustrate the changes in student population by gender at Potomac State College of West Virginia University since 2015.

YearTotalMenWomen
2015-161,475672803
2016-171,452
-23
643
-29
809
6
2017-181,410
-42
614
-29
796
-13
2018-191,340
-70
583
-31
757
-39
2019-201,300
-40
601
18
699
-58
2020-211,193
-107
524
-77
669
-30
2021-221,174
-19
554
30
620
-49
2022-231,145
-29
485
-69
660
40
2023-241,143
-2
473
-12
670
10
2024-251,077
-66
411
-62
666
-4
Average1,271556715
Potomac State College of West Virginia University Enrollment Trends Chart

Enrollment by Race/Ethnicity Changes

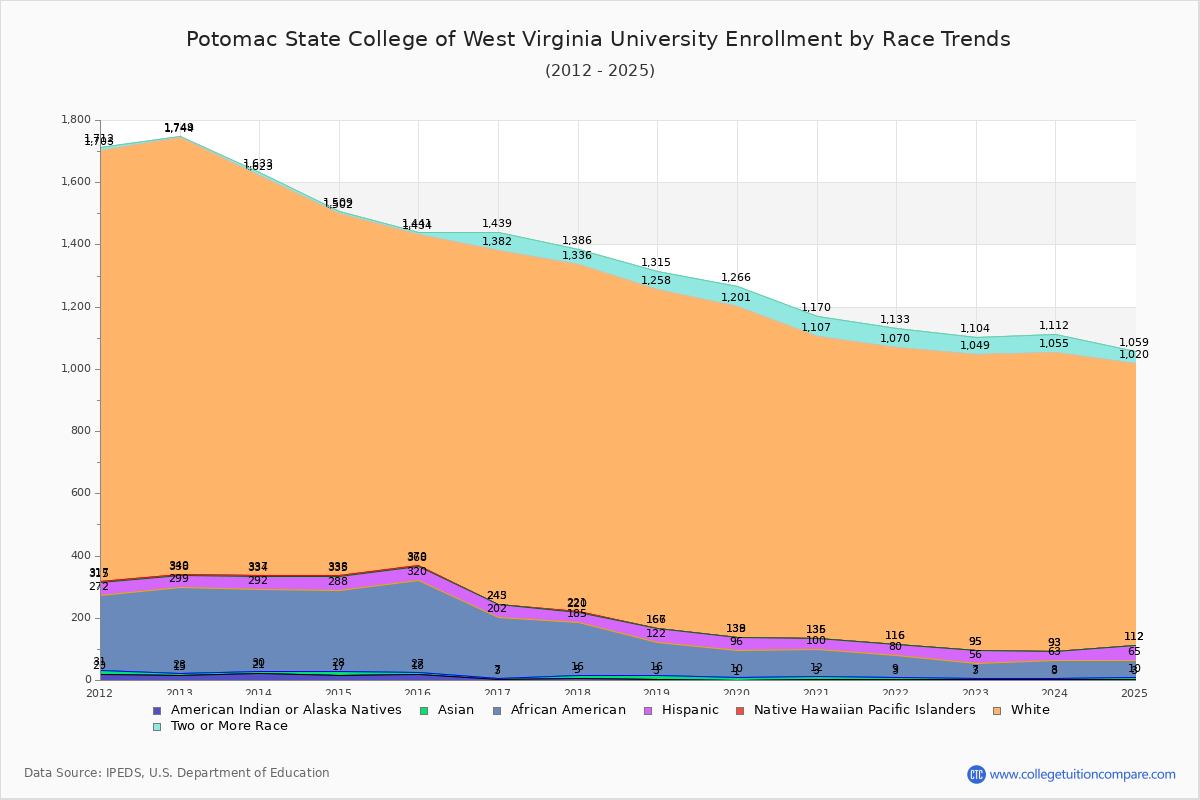
The percentage of white students is 84.31%. The percentage was 72.14% 10 years ago and Potomac State College of West Vi still has a high percentage of white students. 0.65% of enrolled students is Asian and 5.11% is black students. Hispanic students comprise 4.36% of the student body.

Over the past 10 years, the racial composition has shifted. The percentage of white students increased from 72.14% to 84.31%. Asian enrollment grew from 0.61% to 0.65%. Black student enrollment decreased from 19.86% to 5.11%. Hispanic student representation expanded from 3.25% to 4.36%.

The overall racial diversity, measured by the Census Bureau Diversity Index, is 0.2833 which indicates that not very diverse. This decreased from 0.4389 a decade ago, suggesting that racial diversity has declined.

The following table and chart illustrate the student population trends by race/ethnicity at Potomac State College of West Virginia University over the past 11 years (2015-2025).

YearAmerican Indian or Native AmericanAsianBlackHispanicNative Hawaiian or Other Pacific IslanderWhiteTwo or More Races
2015-161892934821,0647
2016-17341954121,13757
2017-185111693511,11550
2018-193131064411,09157
2019-2019864211,06265
2020-21398835197163
2021-22367136095463
2022-23344939095455
2023-24355530096257
2024-25375547090839
Average581174011,02251
Potomac State College of West Virginia University Enrollment by Race Trends Chart

Distance Learning (Online Courses) Enrollment Changes

241 students are enrolled in online degree programs exclusively for the academic year 2024-2025, which is 22% of total students. The number of online students has increased 653.13% since 2015. The following table and chart illustrate the changes in the online student population by enrolled type at Potomac State College of West Virginia University from 2015 to 2025.

YearTotal EnrollmentOnline CompletelyEnrolled in Some Online CoursesNot Enrolled in Online Courses
2015-161,475322311,212
2016-171,452282111,213
2017-181,410682781,064
2018-191,340762361,028
2019-201,30089274937
2020-211,19392870231
2021-221,174136501537
2022-231,145188479478
2023-241,143211515417
2024-251,077241494342
Average1,271116409746

Ratings & Review

Share your experiences and thoughts about Potomac State College of West Virginia University. It will be a great help to applicants and prospective students!