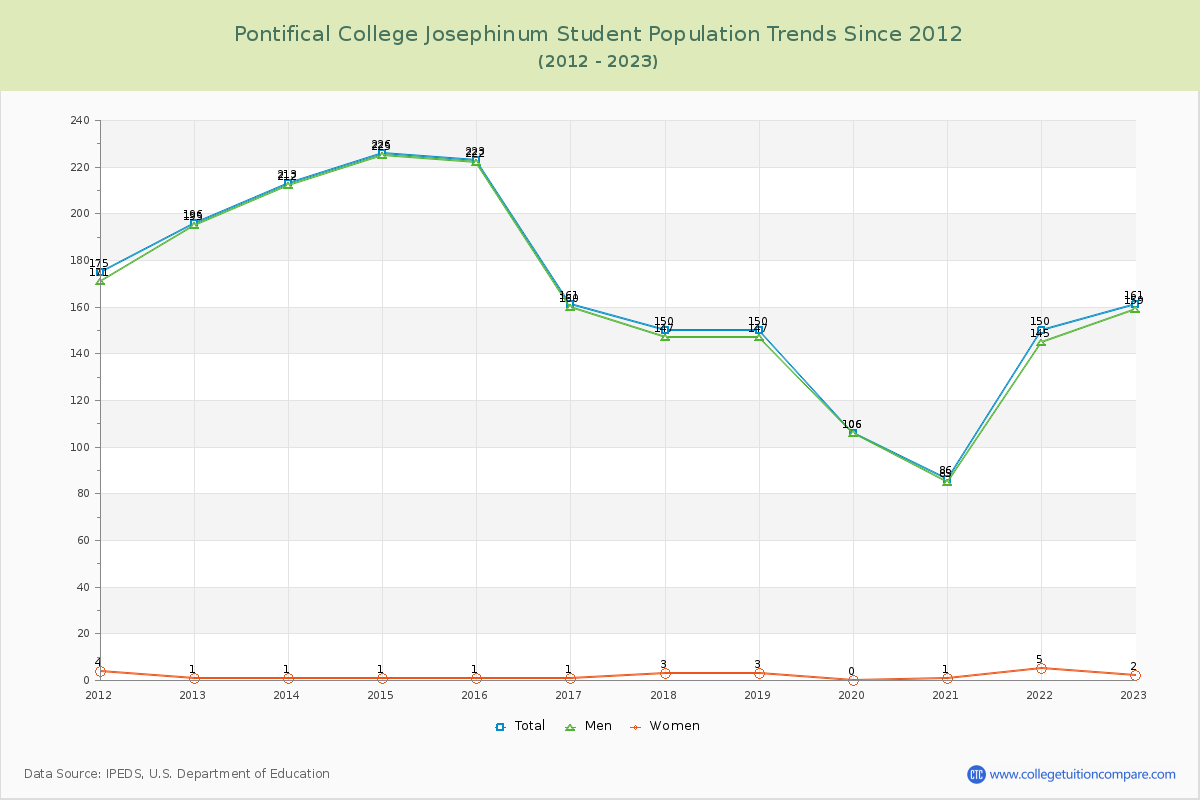
Student Population Changes
The average student population over the last 12 years is 166 where 161 students are attending the school for the academic year 2022-2023.
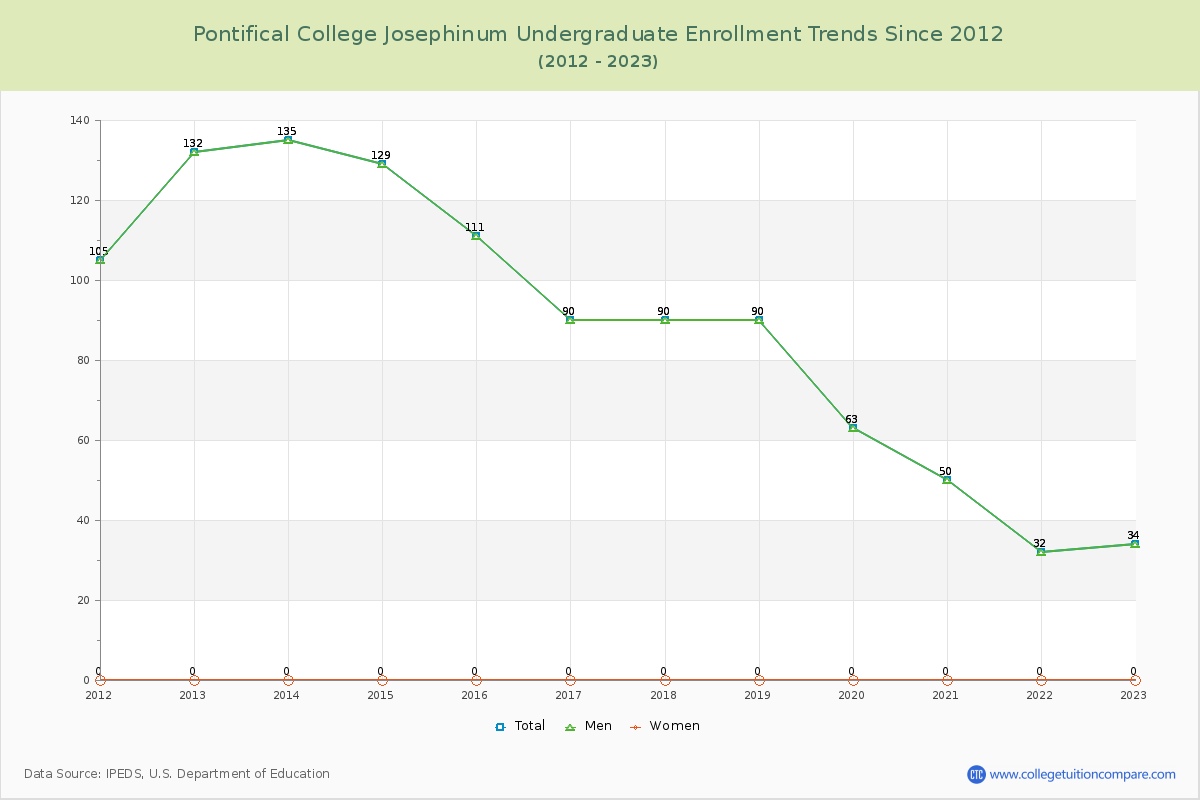
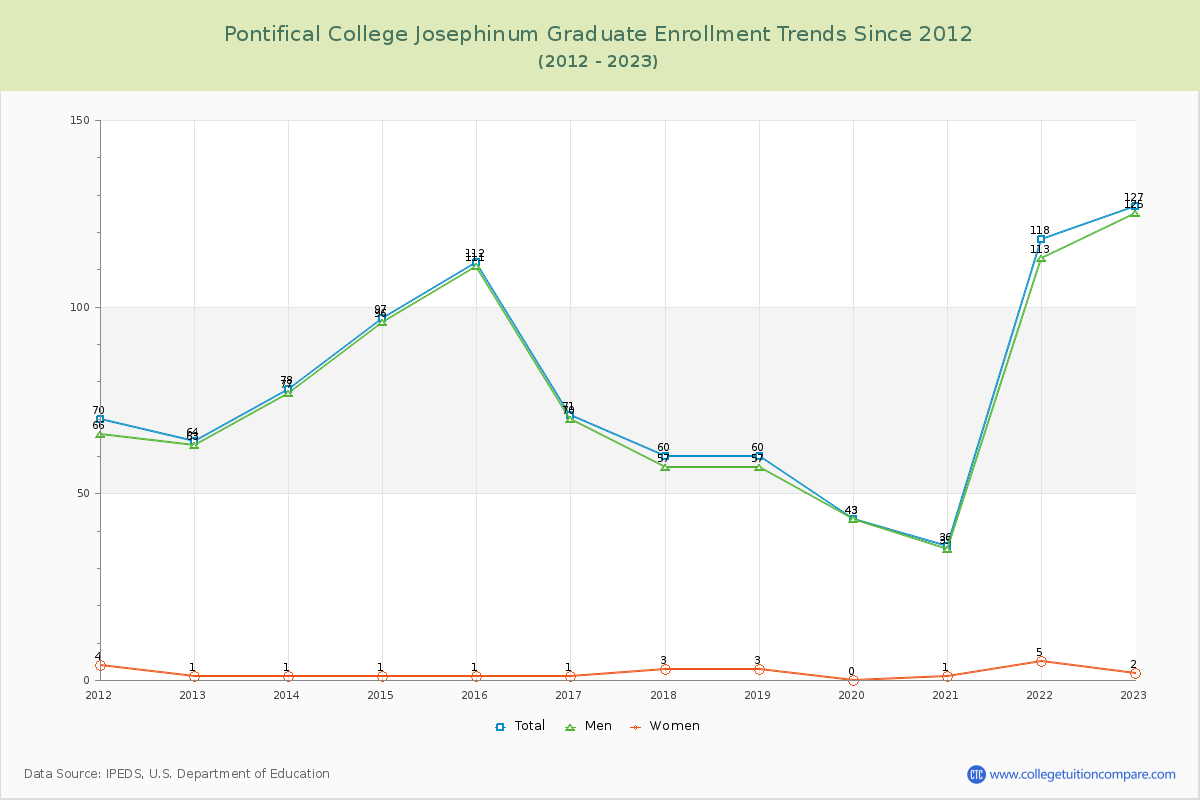
21.12% of total students is undergraduate students and 78.88% students is graduate students. The number of undergraduate students has decreased by 98 and the graduate enrollment has increased by 63 over past 10 years.
The female to male ratio is 0.01 to 1 and it means that there are far more male students enrolled in Pontifical College Josephinum than female students.
The following table and chart illustrate the changes in student population by gender at Pontifical College Josephinum since 2012.
| Year | Total | Undergraduate | Graduate | ||||
|---|---|---|---|---|---|---|---|
| Total | Men | Women | Total | Men | Women | ||
| 2012-13 | 196 | 132 | 132 | 0 | 64 | 63 | 1 |
| 2013-14 | 213 17 | 135 3 | 135 3 | 0 0 | 78 14 | 77 14 | 1 0 |
| 2014-15 | 226 13 | 129 -6 | 129 -6 | 0 0 | 97 19 | 96 19 | 1 0 |
| 2015-16 | 223 -3 | 111 -18 | 111 -18 | 0 0 | 112 15 | 111 15 | 1 0 |
| 2016-17 | 161 -62 | 90 -21 | 90 -21 | 0 0 | 71 -41 | 70 -41 | 1 0 |
| 2017-18 | 150 -11 | 90 0 | 90 0 | 0 0 | 60 -11 | 57 -13 | 3 2 |
| 2018-19 | 150 0 | 90 0 | 90 0 | 0 0 | 60 0 | 57 0 | 3 0 |
| 2019-20 | 106 -44 | 63 -27 | 63 -27 | 0 0 | 43 -17 | 43 -14 | 0 -3 |
| 2020-21 | 86 -20 | 50 -13 | 50 -13 | 0 0 | 36 -7 | 35 -8 | 1 1 |
| 2021-22 | 150 64 | 32 -18 | 32 -18 | 0 0 | 118 82 | 113 78 | 5 4 |
| 2022-23 | 161 11 | 34 2 | 34 2 | 0 0 | 127 9 | 125 12 | 2 -3 |
| Average | 166 | 87 | 87 | 0 | 79 | 77 | 2 |