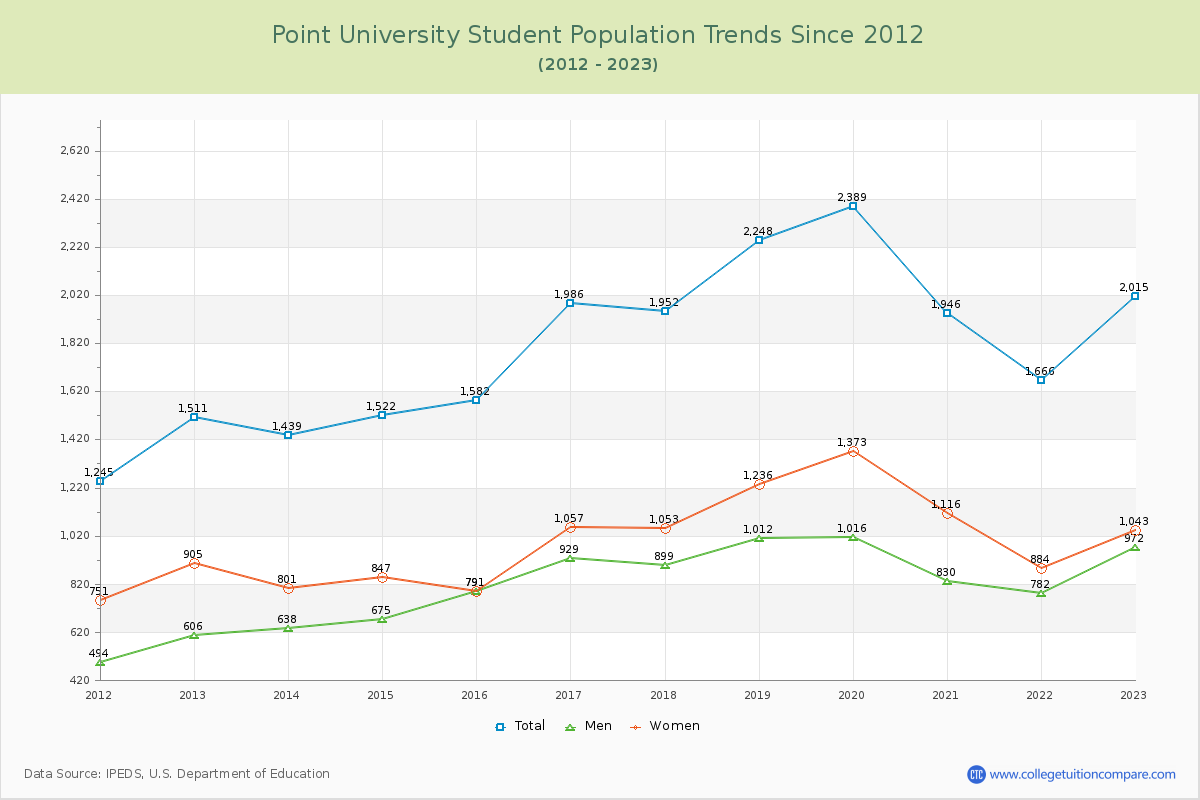
Student Population Changes
The average student population over the last 12 years is 1,841 where 2,015 students are attending the school for the academic year 2022-2023.
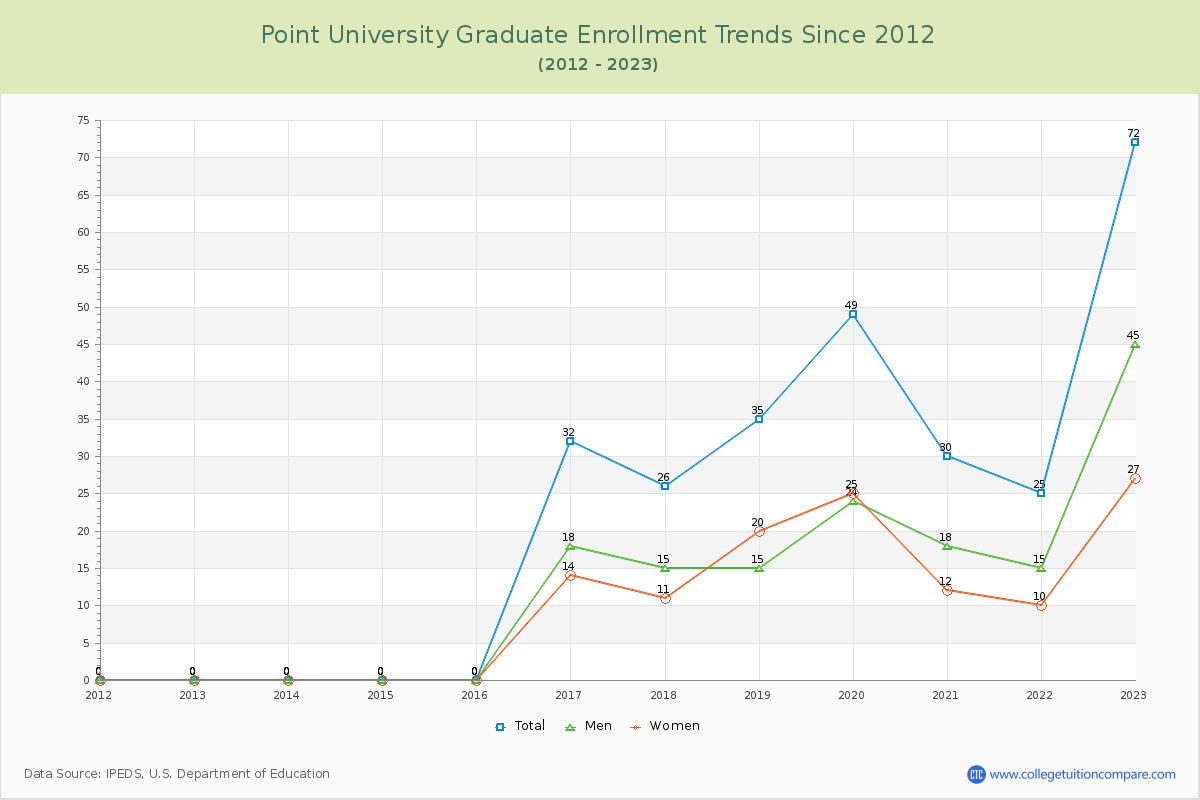
96.43% of total students is undergraduate students and 3.57% students is graduate students. The number of undergraduate students has increased by 432 and the graduate enrollment has increased by 72 over past 10 years.
The female to male ratio is 1.07 to 1 and it means that there are similar numbers of female and male students enrolled in Point.
The following table and chart illustrate the changes in student population by gender at Point University since 2012.
| Year | Total | Undergraduate | Graduate | ||||
|---|---|---|---|---|---|---|---|
| Total | Men | Women | Total | Men | Women | ||
| 2012-13 | 1,511 | 1,511 | 606 | 905 | 0 | 0 | 0 |
| 2013-14 | 1,439 -72 | 1,439 -72 | 638 32 | 801 -104 | 0 0 | 0 0 | 0 0 |
| 2014-15 | 1,522 83 | 1,522 83 | 675 37 | 847 46 | 0 0 | 0 0 | 0 0 |
| 2015-16 | 1,582 60 | 1,582 60 | 791 116 | 791 -56 | 0 0 | 0 0 | 0 0 |
| 2016-17 | 1,986 404 | 1,954 372 | 911 120 | 1,043 252 | 32 32 | 18 18 | 14 14 |
| 2017-18 | 1,952 -34 | 1,926 -28 | 884 -27 | 1,042 -1 | 26 -6 | 15 -3 | 11 -3 |
| 2018-19 | 2,248 296 | 2,213 287 | 997 113 | 1,216 174 | 35 9 | 15 0 | 20 9 |
| 2019-20 | 2,389 141 | 2,340 127 | 992 -5 | 1,348 132 | 49 14 | 24 9 | 25 5 |
| 2020-21 | 1,946 -443 | 1,916 -424 | 812 -180 | 1,104 -244 | 30 -19 | 18 -6 | 12 -13 |
| 2021-22 | 1,666 -280 | 1,641 -275 | 767 -45 | 874 -230 | 25 -5 | 15 -3 | 10 -2 |
| 2022-23 | 2,015 349 | 1,943 302 | 927 160 | 1,016 142 | 72 47 | 45 30 | 27 17 |
| Average | 1,841 | 1,817 | 818 | 999 | 24 | 14 | 11 |