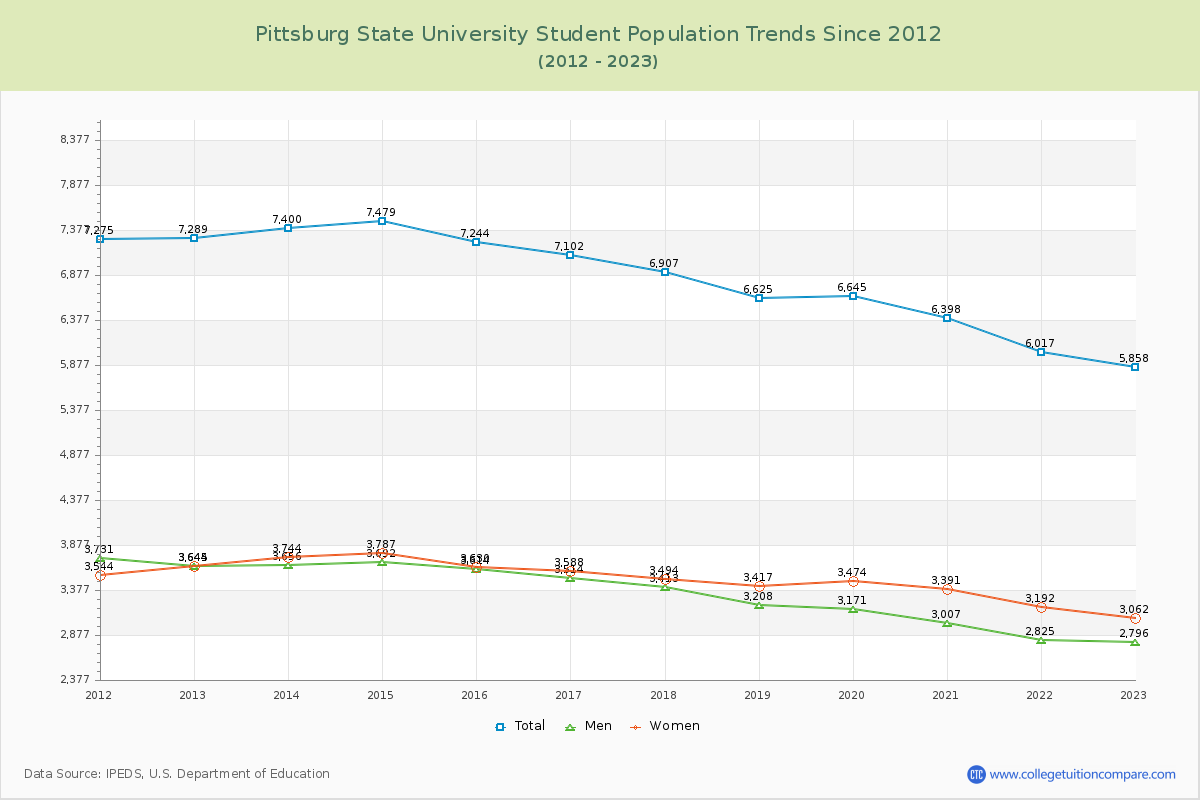
Student Population Changes
The average student population over the last 12 years is 6,815 where 5,858 students are attending the school for the academic year 2022-2023.
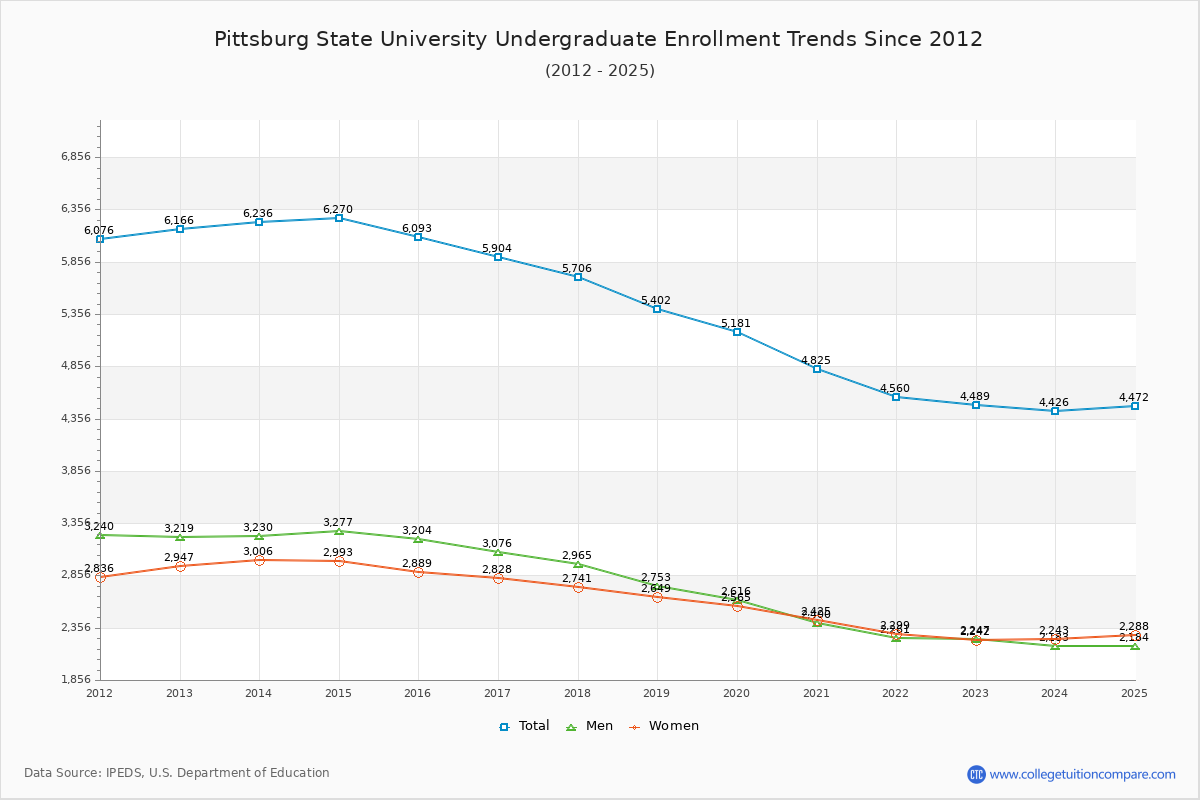
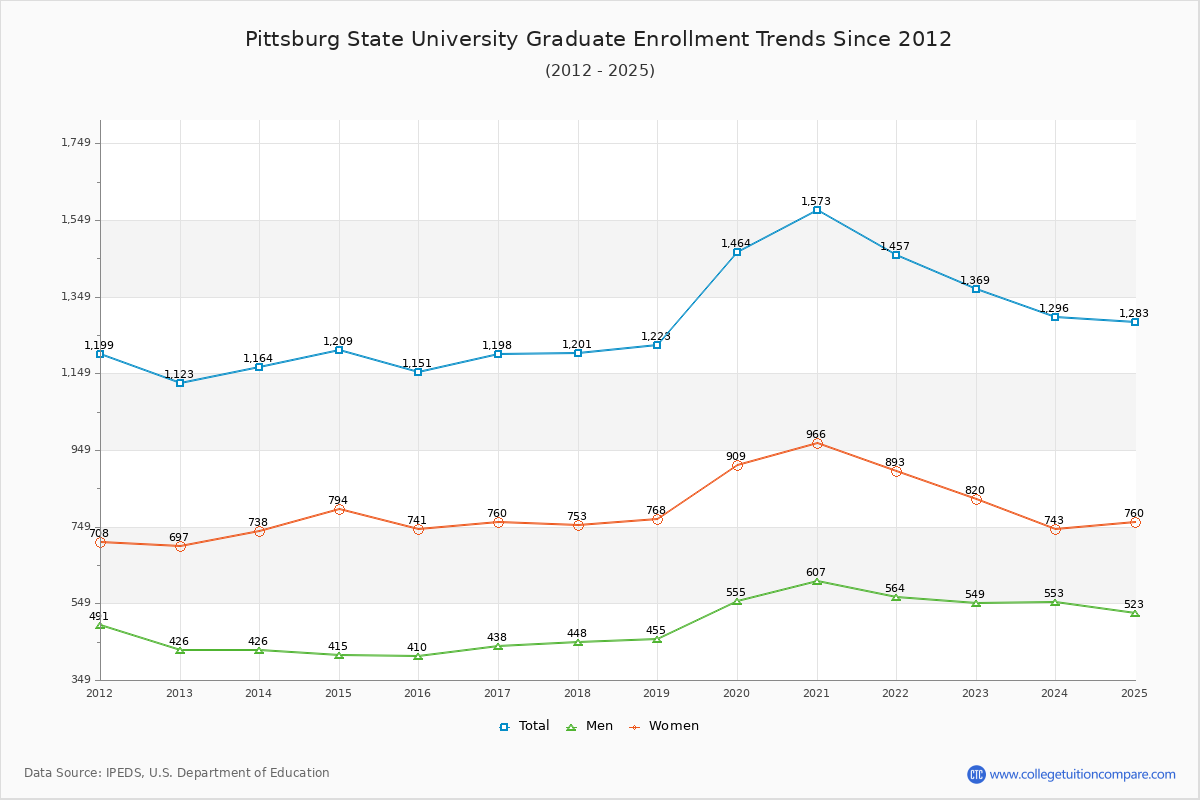
76.63% of total students is undergraduate students and 23.37% students is graduate students. The number of undergraduate students has decreased by 1,677 and the graduate enrollment has increased by 246 over past 10 years.
The female to male ratio is 1.10 to 1 and it means that there are similar numbers of female and male students enrolled in Pitt State.
The following table and chart illustrate the changes in student population by gender at Pittsburg State University since 2012.
| Year | Total | Undergraduate | Graduate | ||||
|---|---|---|---|---|---|---|---|
| Total | Men | Women | Total | Men | Women | ||
| 2012-13 | 7,289 | 6,166 | 3,219 | 2,947 | 1,123 | 426 | 697 |
| 2013-14 | 7,400 111 | 6,236 70 | 3,230 11 | 3,006 59 | 1,164 41 | 426 0 | 738 41 |
| 2014-15 | 7,479 79 | 6,270 34 | 3,277 47 | 2,993 -13 | 1,209 45 | 415 -11 | 794 56 |
| 2015-16 | 7,244 -235 | 6,093 -177 | 3,204 -73 | 2,889 -104 | 1,151 -58 | 410 -5 | 741 -53 |
| 2016-17 | 7,102 -142 | 5,904 -189 | 3,076 -128 | 2,828 -61 | 1,198 47 | 438 28 | 760 19 |
| 2017-18 | 6,907 -195 | 5,706 -198 | 2,965 -111 | 2,741 -87 | 1,201 3 | 448 10 | 753 -7 |
| 2018-19 | 6,625 -282 | 5,402 -304 | 2,753 -212 | 2,649 -92 | 1,223 22 | 455 7 | 768 15 |
| 2019-20 | 6,645 20 | 5,181 -221 | 2,616 -137 | 2,565 -84 | 1,464 241 | 555 100 | 909 141 |
| 2020-21 | 6,398 -247 | 4,825 -356 | 2,400 -216 | 2,425 -140 | 1,573 109 | 607 52 | 966 57 |
| 2021-22 | 6,017 -381 | 4,560 -265 | 2,261 -139 | 2,299 -126 | 1,457 -116 | 564 -43 | 893 -73 |
| 2022-23 | 5,858 -159 | 4,489 -71 | 2,247 -14 | 2,242 -57 | 1,369 -88 | 549 -15 | 820 -73 |
| Average | 6,815 | 5,530 | 2,841 | 2,689 | 1,285 | 481 | 804 |