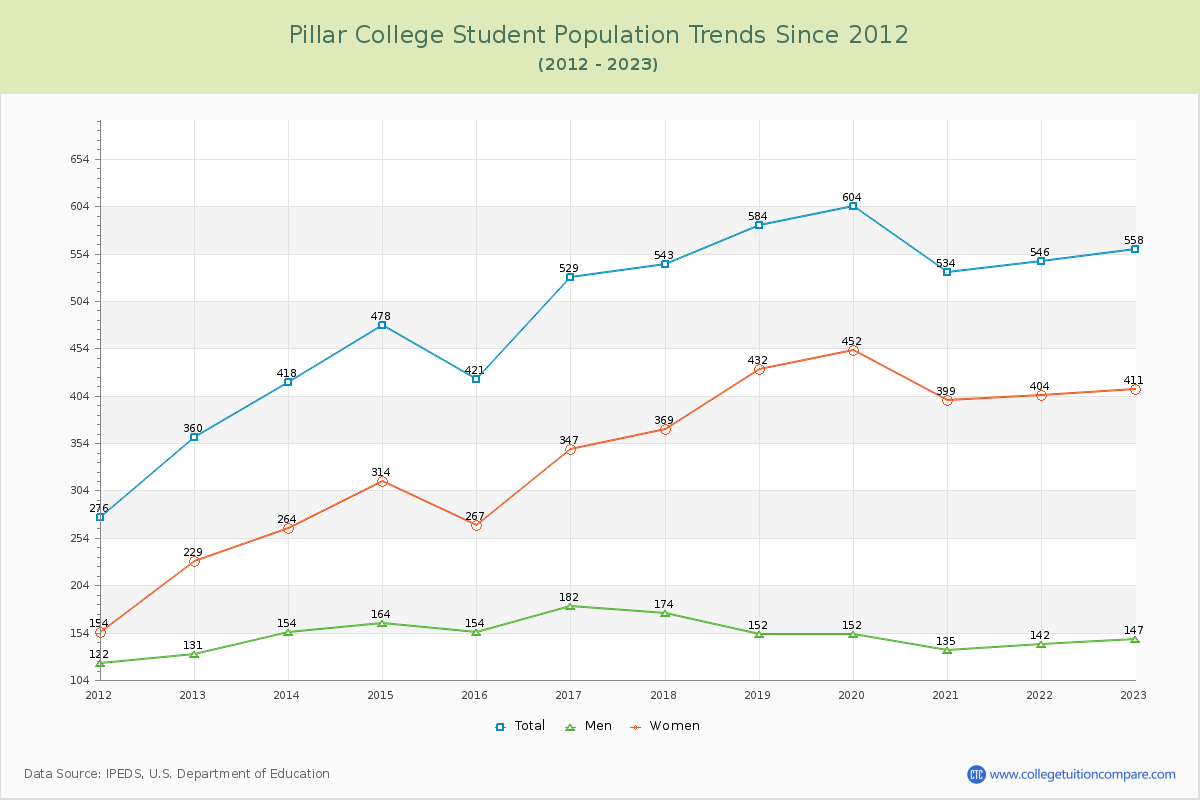
Student Population Changes
The average student population over the last 12 years is 507 where 558 students are attending the school for the academic year 2022-2023.
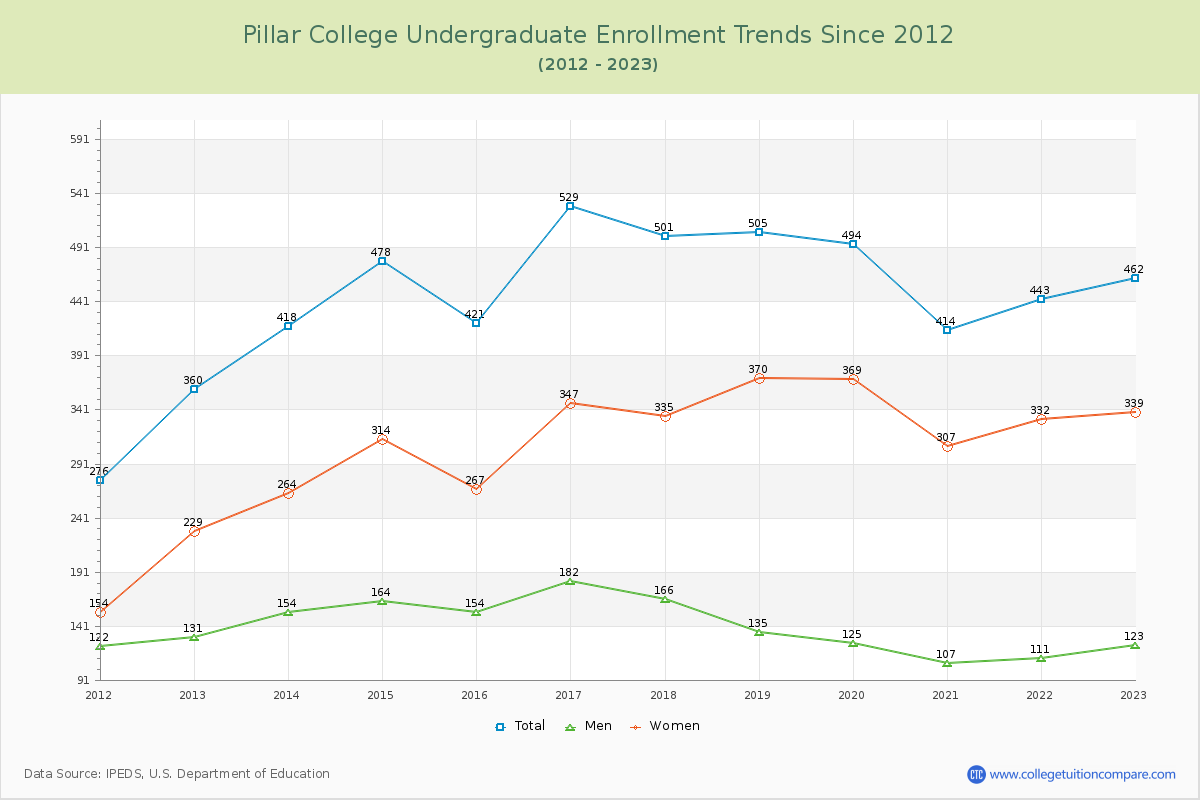
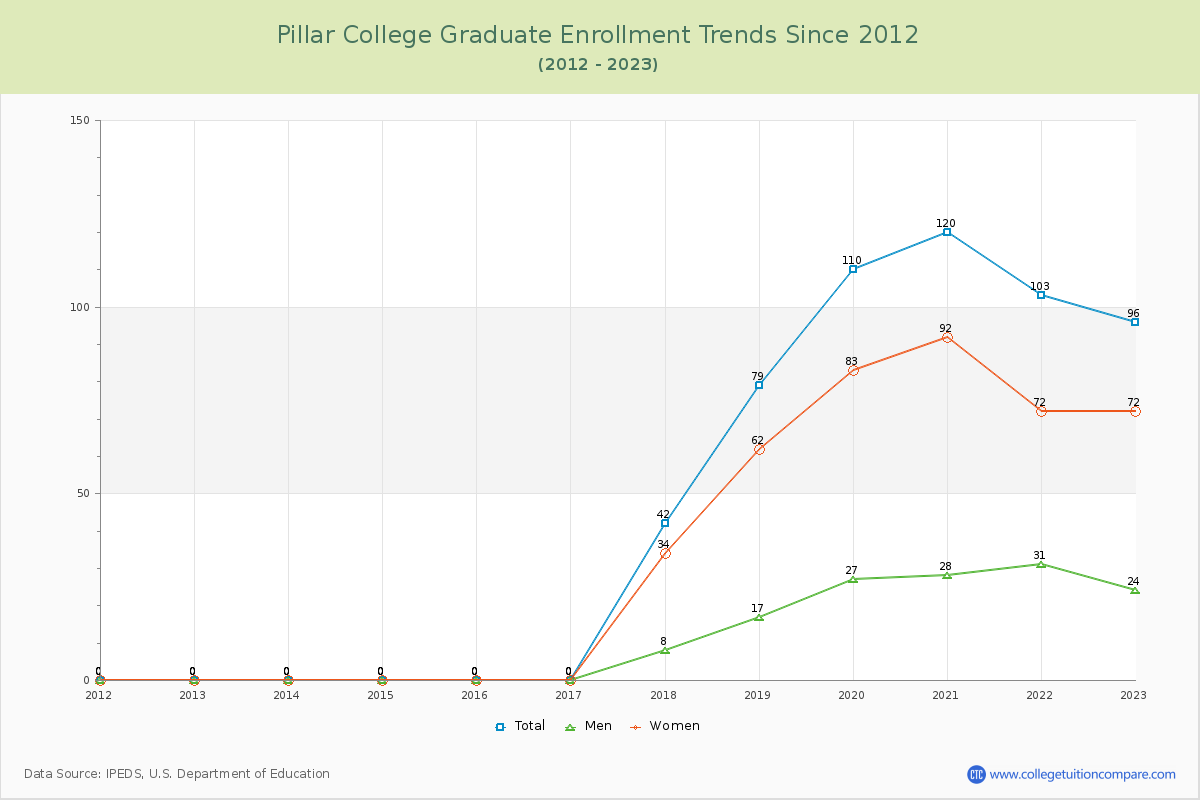
82.80% of total students is undergraduate students and 17.20% students is graduate students. The number of undergraduate students has increased by 102 and the graduate enrollment has increased by 96 over past 10 years.
The female to male ratio is 2.80 to 1 and it means that there are far more female students enrolled in Pillar than male students.
The following table and chart illustrate the changes in student population by gender at Pillar College since 2012.
| Year | Total | Undergraduate | Graduate | ||||
|---|---|---|---|---|---|---|---|
| Total | Men | Women | Total | Men | Women | ||
| 2012-13 | 360 | 360 | 131 | 229 | 0 | 0 | 0 |
| 2013-14 | 418 58 | 418 58 | 154 23 | 264 35 | 0 0 | 0 0 | 0 0 |
| 2014-15 | 478 60 | 478 60 | 164 10 | 314 50 | 0 0 | 0 0 | 0 0 |
| 2015-16 | 421 -57 | 421 -57 | 154 -10 | 267 -47 | 0 0 | 0 0 | 0 0 |
| 2016-17 | 529 108 | 529 108 | 182 28 | 347 80 | 0 0 | 0 0 | 0 0 |
| 2017-18 | 543 14 | 501 -28 | 166 -16 | 335 -12 | 42 42 | 8 8 | 34 34 |
| 2018-19 | 584 41 | 505 4 | 135 -31 | 370 35 | 79 37 | 17 9 | 62 28 |
| 2019-20 | 604 20 | 494 -11 | 125 -10 | 369 -1 | 110 31 | 27 10 | 83 21 |
| 2020-21 | 534 -70 | 414 -80 | 107 -18 | 307 -62 | 120 10 | 28 1 | 92 9 |
| 2021-22 | 546 12 | 443 29 | 111 4 | 332 25 | 103 -17 | 31 3 | 72 -20 |
| 2022-23 | 558 12 | 462 19 | 123 12 | 339 7 | 96 -7 | 24 -7 | 72 0 |
| Average | 507 | 457 | 141 | 316 | 50 | 12 | 38 |