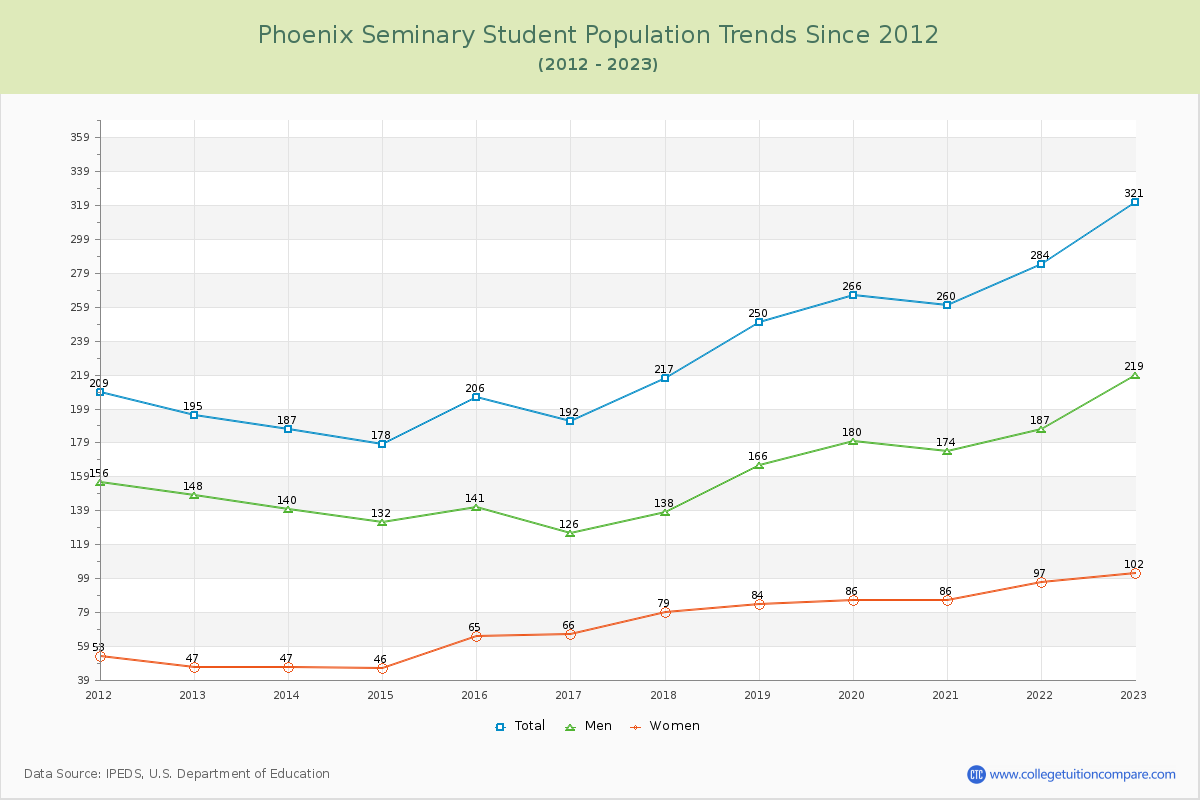
Student Population Changes
The average student population over the last 12 years is 232 where 321 students are attending the school for the academic year 2022-2023.
The female to male ratio is 0.47 to 1 and it means that there are far more male students enrolled in Phoenix Seminary than female students.
The following table and chart illustrate the changes in student population by gender at Phoenix Seminary since 2012.
| Year | Total | Men | Women |
|---|---|---|---|
| 2012-13 | 195 | 148 | 47 |
| 2013-14 | 187 -8 | 140 -8 | 47 0 |
| 2014-15 | 178 -9 | 132 -8 | 46 -1 |
| 2015-16 | 206 28 | 141 9 | 65 19 |
| 2016-17 | 192 -14 | 126 -15 | 66 1 |
| 2017-18 | 217 25 | 138 12 | 79 13 |
| 2018-19 | 250 33 | 166 28 | 84 5 |
| 2019-20 | 266 16 | 180 14 | 86 2 |
| 2020-21 | 260 -6 | 174 -6 | 86 0 |
| 2021-22 | 284 24 | 187 13 | 97 11 |
| 2022-23 | 321 37 | 219 32 | 102 5 |
| Average | 232 | 159 | 73 |