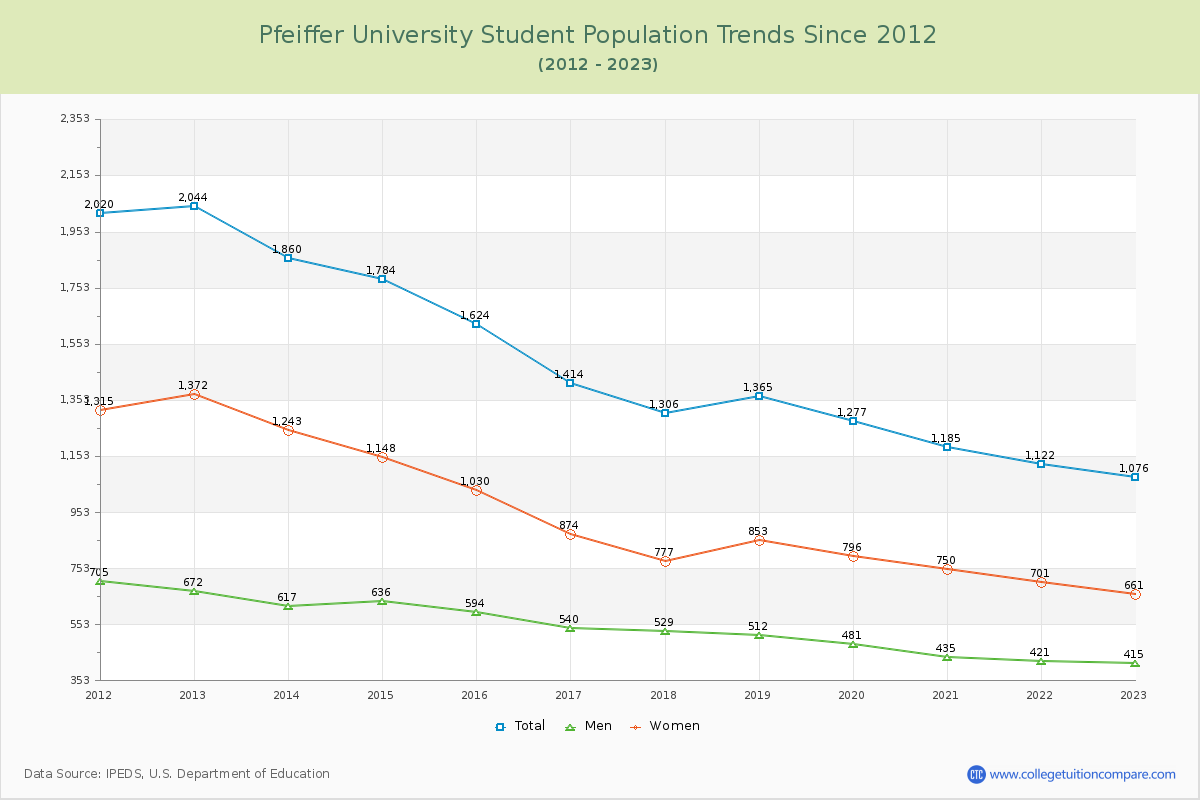
Student Population Changes
The average student population over the last 12 years is 1,460 where 1,076 students are attending the school for the academic year 2022-2023.
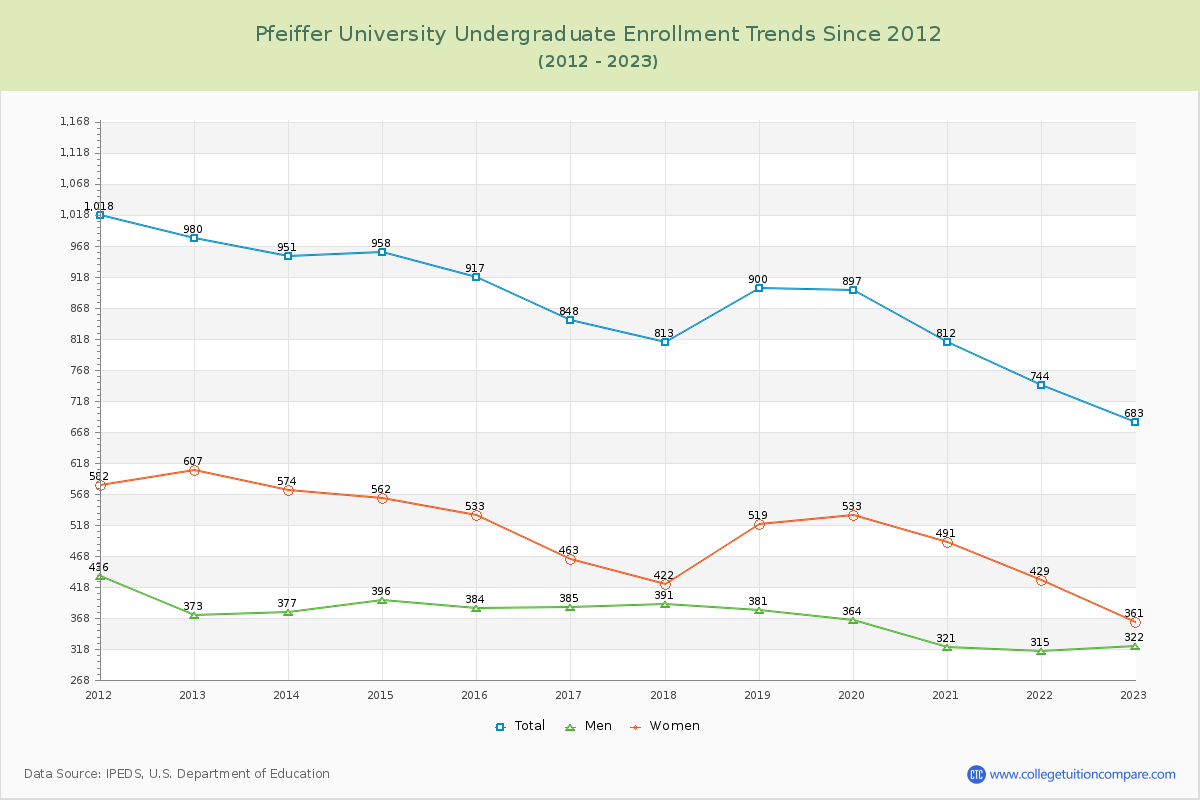
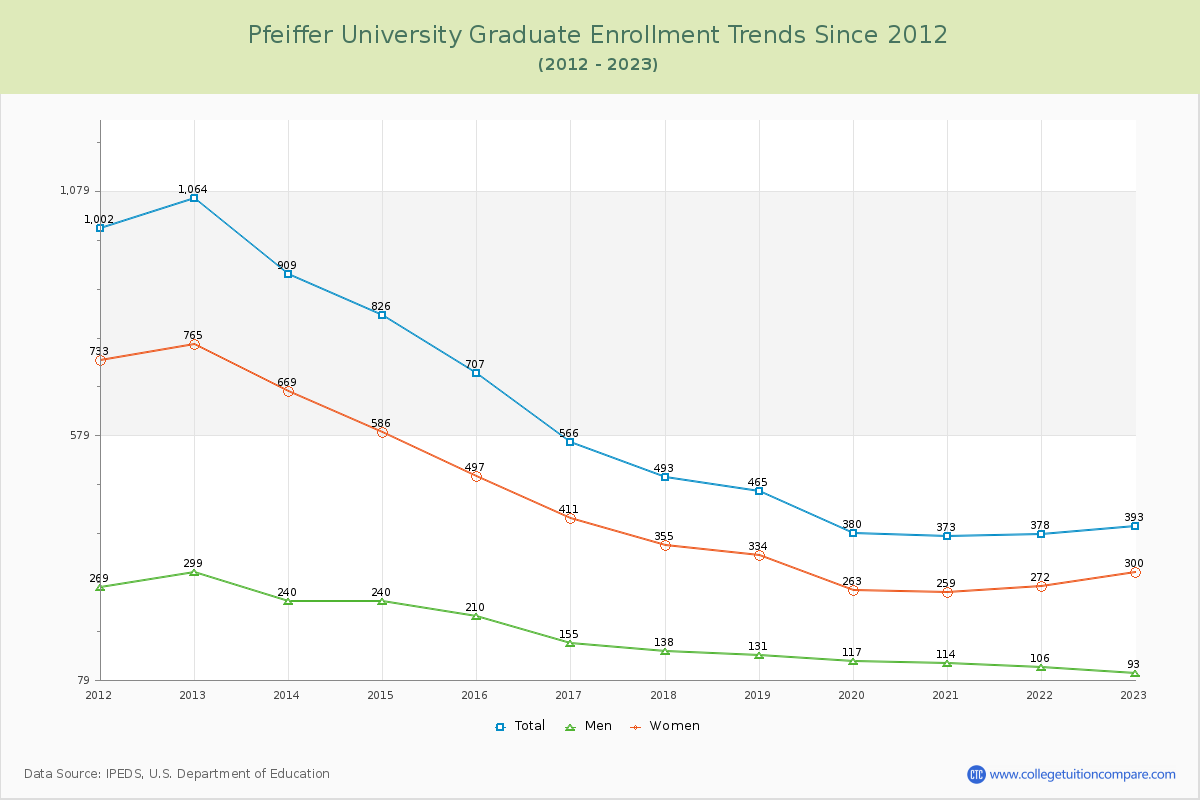
63.48% of total students is undergraduate students and 36.52% students is graduate students. The number of undergraduate students has decreased by 297 and the graduate enrollment has decreased by 671 over past 10 years.
The female to male ratio is 1.59 to 1 and it means that there are more female students enrolled in Pfeiffer than male students.
The following table and chart illustrate the changes in student population by gender at Pfeiffer University since 2012.
| Year | Total | Undergraduate | Graduate | ||||
|---|---|---|---|---|---|---|---|
| Total | Men | Women | Total | Men | Women | ||
| 2012-13 | 2,044 | 980 | 373 | 607 | 1,064 | 299 | 765 |
| 2013-14 | 1,860 -184 | 951 -29 | 377 4 | 574 -33 | 909 -155 | 240 -59 | 669 -96 |
| 2014-15 | 1,784 -76 | 958 7 | 396 19 | 562 -12 | 826 -83 | 240 0 | 586 -83 |
| 2015-16 | 1,624 -160 | 917 -41 | 384 -12 | 533 -29 | 707 -119 | 210 -30 | 497 -89 |
| 2016-17 | 1,414 -210 | 848 -69 | 385 1 | 463 -70 | 566 -141 | 155 -55 | 411 -86 |
| 2017-18 | 1,306 -108 | 813 -35 | 391 6 | 422 -41 | 493 -73 | 138 -17 | 355 -56 |
| 2018-19 | 1,365 59 | 900 87 | 381 -10 | 519 97 | 465 -28 | 131 -7 | 334 -21 |
| 2019-20 | 1,277 -88 | 897 -3 | 364 -17 | 533 14 | 380 -85 | 117 -14 | 263 -71 |
| 2020-21 | 1,185 -92 | 812 -85 | 321 -43 | 491 -42 | 373 -7 | 114 -3 | 259 -4 |
| 2021-22 | 1,122 -63 | 744 -68 | 315 -6 | 429 -62 | 378 5 | 106 -8 | 272 13 |
| 2022-23 | 1,076 -46 | 683 -61 | 322 7 | 361 -68 | 393 15 | 93 -13 | 300 28 |
| Average | 1,460 | 864 | 364 | 499 | 596 | 168 | 428 |