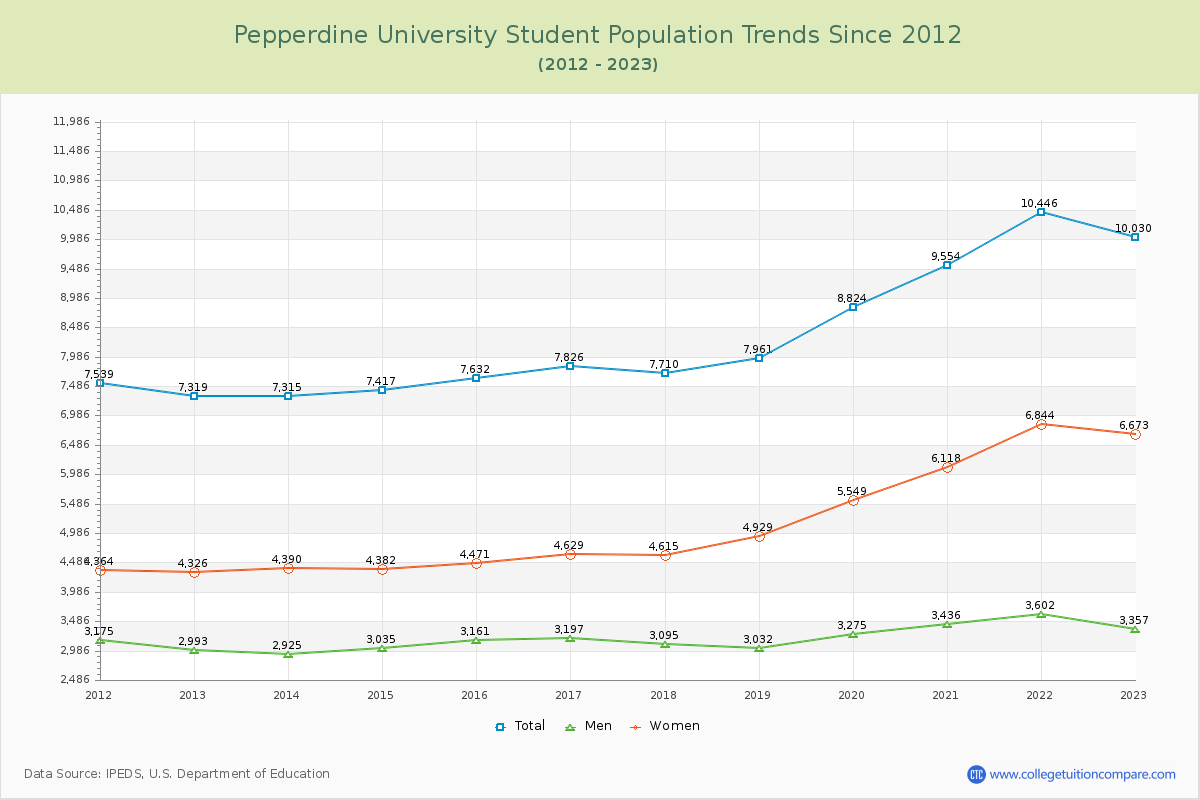
Student Population Changes
The average student population over the last 12 years is 8,367 where 10,030 students are attending the school for the academic year 2022-2023.
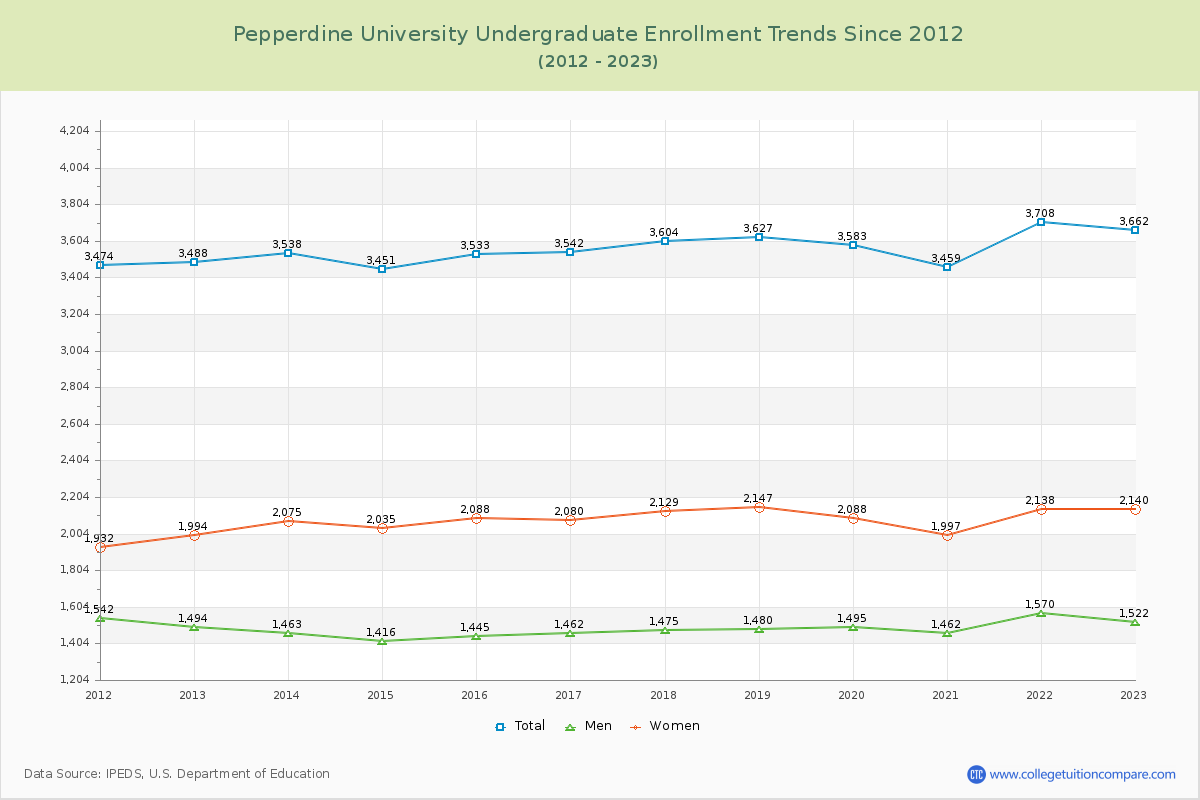
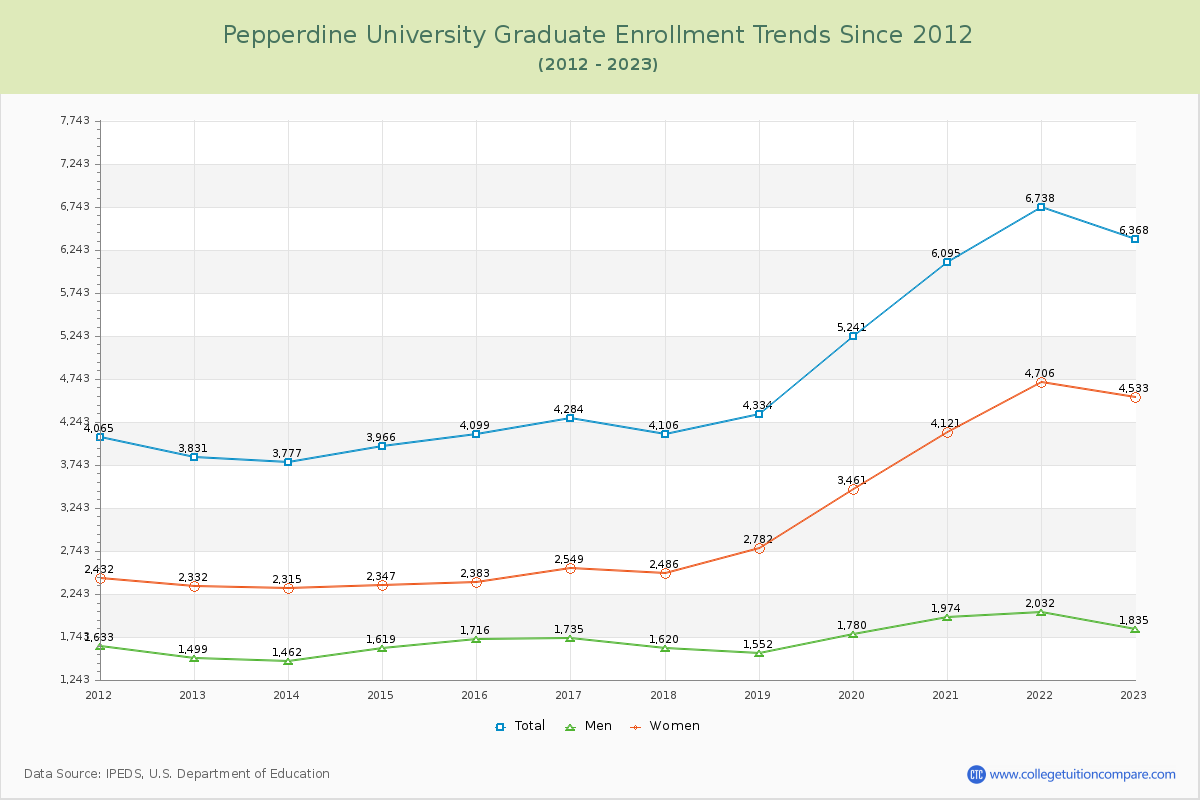
36.51% of total students is undergraduate students and 63.49% students is graduate students. The number of undergraduate students has increased by 174 and the graduate enrollment has increased by 2,537 over past 10 years.
The female to male ratio is 1.99 to 1 and it means that there are more female students enrolled in Pepperdine than male students.
The following table and chart illustrate the changes in student population by gender at Pepperdine University since 2012.
| Year | Total | Undergraduate | Graduate | ||||
|---|---|---|---|---|---|---|---|
| Total | Men | Women | Total | Men | Women | ||
| 2012-13 | 7,319 | 3,488 | 1,494 | 1,994 | 3,831 | 1,499 | 2,332 |
| 2013-14 | 7,315 -4 | 3,538 50 | 1,463 -31 | 2,075 81 | 3,777 -54 | 1,462 -37 | 2,315 -17 |
| 2014-15 | 7,417 102 | 3,451 -87 | 1,416 -47 | 2,035 -40 | 3,966 189 | 1,619 157 | 2,347 32 |
| 2015-16 | 7,632 215 | 3,533 82 | 1,445 29 | 2,088 53 | 4,099 133 | 1,716 97 | 2,383 36 |
| 2016-17 | 7,826 194 | 3,542 9 | 1,462 17 | 2,080 -8 | 4,284 185 | 1,735 19 | 2,549 166 |
| 2017-18 | 7,710 -116 | 3,604 62 | 1,475 13 | 2,129 49 | 4,106 -178 | 1,620 -115 | 2,486 -63 |
| 2018-19 | 7,961 251 | 3,627 23 | 1,480 5 | 2,147 18 | 4,334 228 | 1,552 -68 | 2,782 296 |
| 2019-20 | 8,824 863 | 3,583 -44 | 1,495 15 | 2,088 -59 | 5,241 907 | 1,780 228 | 3,461 679 |
| 2020-21 | 9,554 730 | 3,459 -124 | 1,462 -33 | 1,997 -91 | 6,095 854 | 1,974 194 | 4,121 660 |
| 2021-22 | 10,446 892 | 3,708 249 | 1,570 108 | 2,138 141 | 6,738 643 | 2,032 58 | 4,706 585 |
| 2022-23 | 10,030 -416 | 3,662 -46 | 1,522 -48 | 2,140 2 | 6,368 -370 | 1,835 -197 | 4,533 -173 |
| Average | 8,367 | 3,563 | 1,480 | 2,083 | 4,804 | 1,711 | 3,092 |