Graduation Rate Changes

The average graduation rate of the last 10 years is 24.89% where the current academic year rate is 0%.
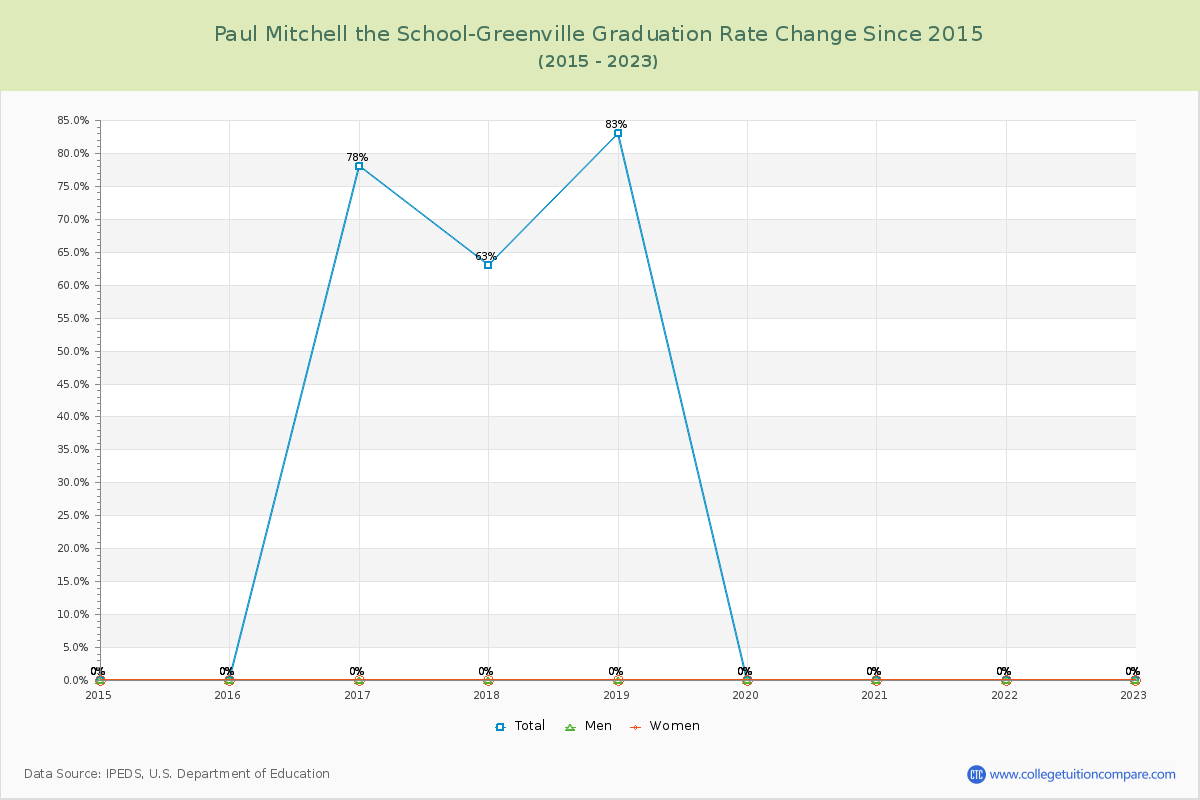
The following table and chart show the changes of graduation rate at Paul Mitchell the School-Greenville over the past 10 years (2014-2023).
TableInteractive ChartDownloadable Chart
YearTotalMenWomen
2014-15 0%0%0%
2015-16 0%0%0%
2016-17 78%0%0%
2017-18 63%0%0%
2018-19 83%0%0%
2019-20 0%0%0%
2020-21 0%0%0%
2021-22 0%0%0%
2022-23 0%0%0%
Average24.89%0.00%0.00%
Graduation Rate Changes of Paul Mitchell the School-Greenville
Paul Mitchell the School-Greenville Graduation Rate Changes Chart

Retention Rate Changes

The average retention rate of the last 10 years is 82.78% for full-time students and 47.11% for part-time students.
The following table shows the changes of retention rate at Paul Mitchell the School-Greenville from 2014 to 2023.
TableChart
YearFull-timePart-time
2014-15100%-
2015-1683%50%
2016-1782%100%
2017-1886%67%
2018-1977%45%
2019-2073%20%
2020-2186%25%
2021-2283%67%
2022-2375%50%
Average82.78%47.11%
Retention Rate Changes of Paul Mitchell the School-Greenville

Student to Faculty Ratio Changes

The average student to faculty ratio over the last 10 years is 14.44 to 1 where the current academic year ratio is 11 to 1. The following table and chart illustrate the change of student to faculty ratio at Paul Mitchell the School-Greenville since 2023.
TableChart
YearStudent to Faculty Ratio
2014-1515:1
2015-1615:1
2016-1715:1
2017-1815:1
2018-1915:1
2019-2015:1
2020-2115:1
2021-2214:1
2022-2311:1
Average14.44:1
Student to Faculty Ratio Changes of Paul Mitchell the School-Greenville
Related Articles and Ads