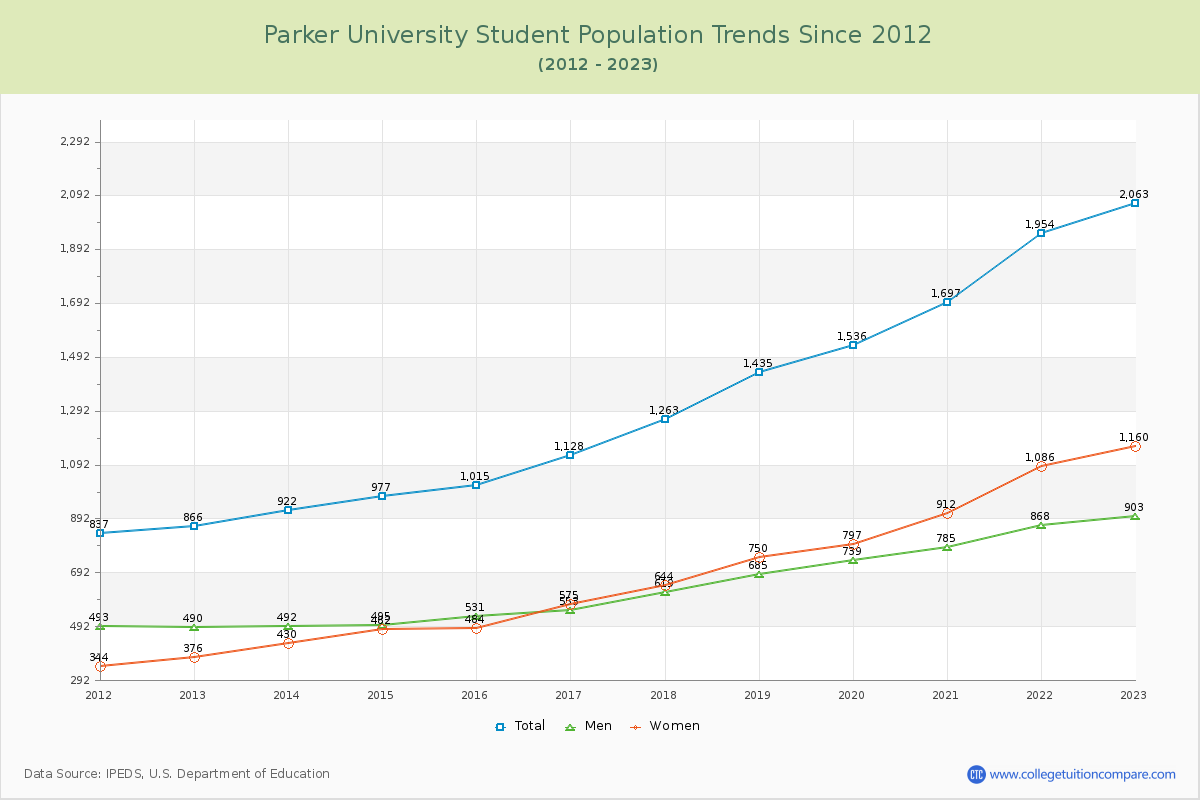
Student Population Changes
The average student population over the last 12 years is 1,351 where 2,063 students are attending the school for the academic year 2022-2023.
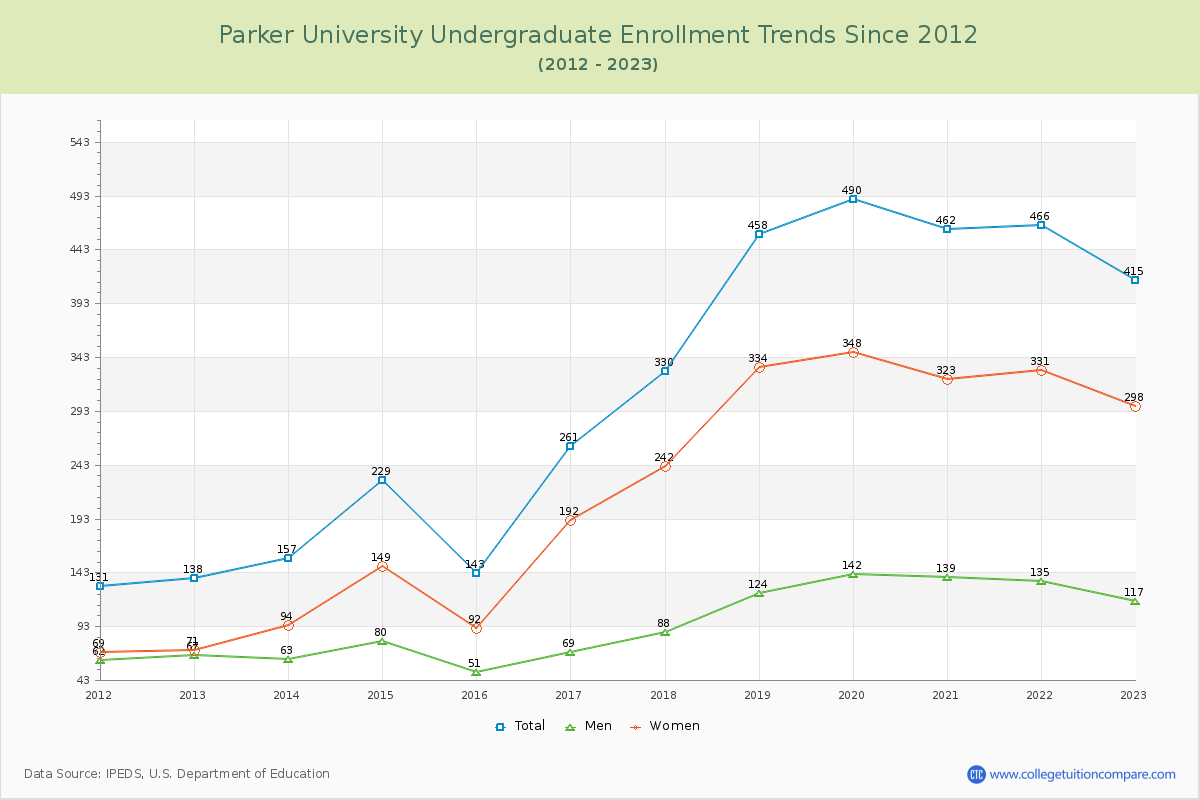
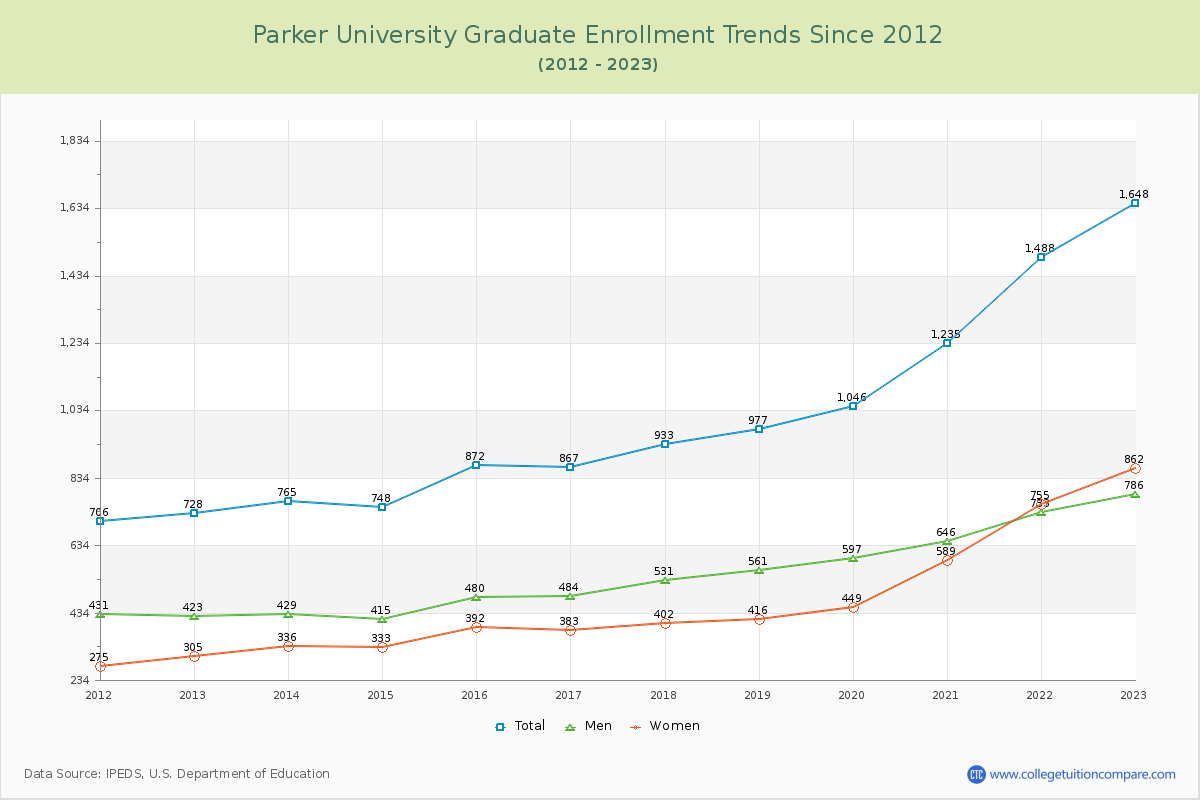
20.12% of total students is undergraduate students and 79.88% students is graduate students. The number of undergraduate students has increased by 277 and the graduate enrollment has increased by 920 over past 10 years.
The female to male ratio is 1.28 to 1 and it means that there are slightly more female students enrolled in Parker than male students.
The following table and chart illustrate the changes in student population by gender at Parker University since 2012.
| Year | Total | Undergraduate | Graduate | ||||
|---|---|---|---|---|---|---|---|
| Total | Men | Women | Total | Men | Women | ||
| 2012-13 | 866 | 138 | 67 | 71 | 728 | 423 | 305 |
| 2013-14 | 922 56 | 157 19 | 63 -4 | 94 23 | 765 37 | 429 6 | 336 31 |
| 2014-15 | 977 55 | 229 72 | 80 17 | 149 55 | 748 -17 | 415 -14 | 333 -3 |
| 2015-16 | 1,015 38 | 143 -86 | 51 -29 | 92 -57 | 872 124 | 480 65 | 392 59 |
| 2016-17 | 1,128 113 | 261 118 | 69 18 | 192 100 | 867 -5 | 484 4 | 383 -9 |
| 2017-18 | 1,263 135 | 330 69 | 88 19 | 242 50 | 933 66 | 531 47 | 402 19 |
| 2018-19 | 1,435 172 | 458 128 | 124 36 | 334 92 | 977 44 | 561 30 | 416 14 |
| 2019-20 | 1,536 101 | 490 32 | 142 18 | 348 14 | 1,046 69 | 597 36 | 449 33 |
| 2020-21 | 1,697 161 | 462 -28 | 139 -3 | 323 -25 | 1,235 189 | 646 49 | 589 140 |
| 2021-22 | 1,954 257 | 466 4 | 135 -4 | 331 8 | 1,488 253 | 733 87 | 755 166 |
| 2022-23 | 2,063 109 | 415 -51 | 117 -18 | 298 -33 | 1,648 160 | 786 53 | 862 107 |
| Average | 1,351 | 323 | 98 | 225 | 1,028 | 553 | 475 |