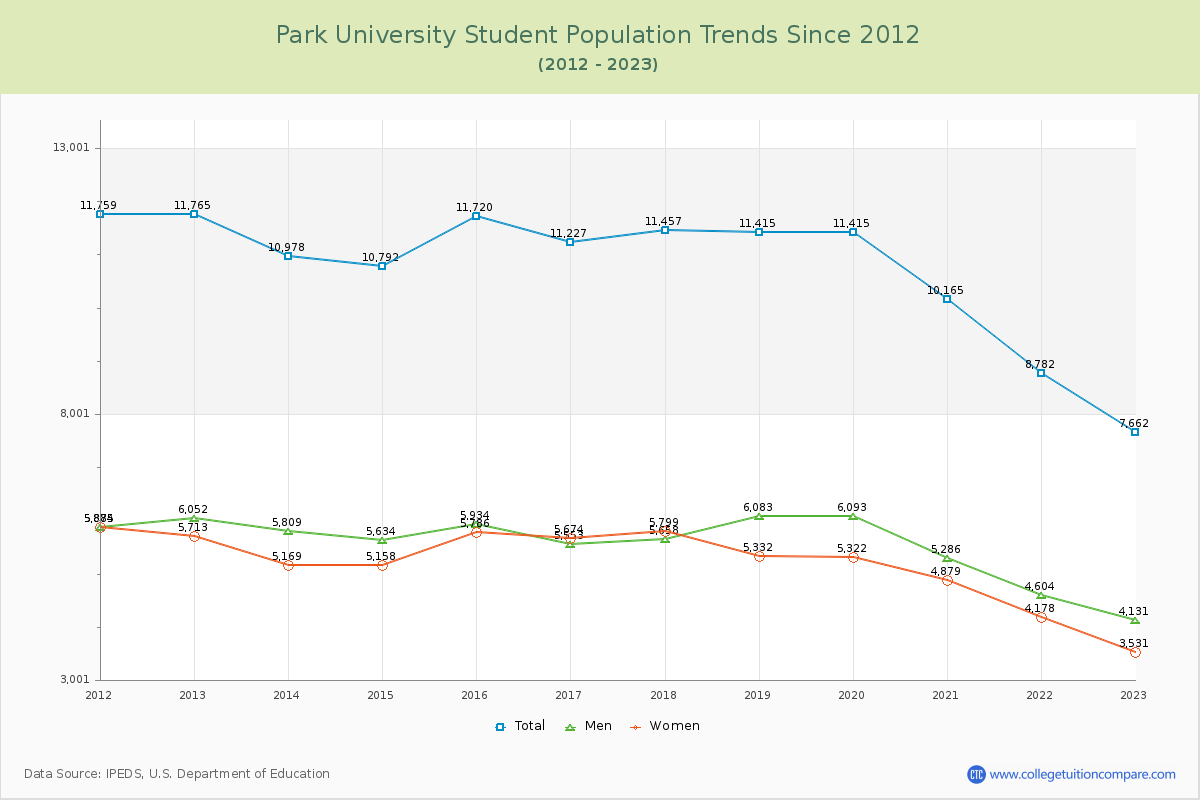
Student Population Changes
The average student population over the last 12 years is 10,671 where 7,662 students are attending the school for the academic year 2022-2023.
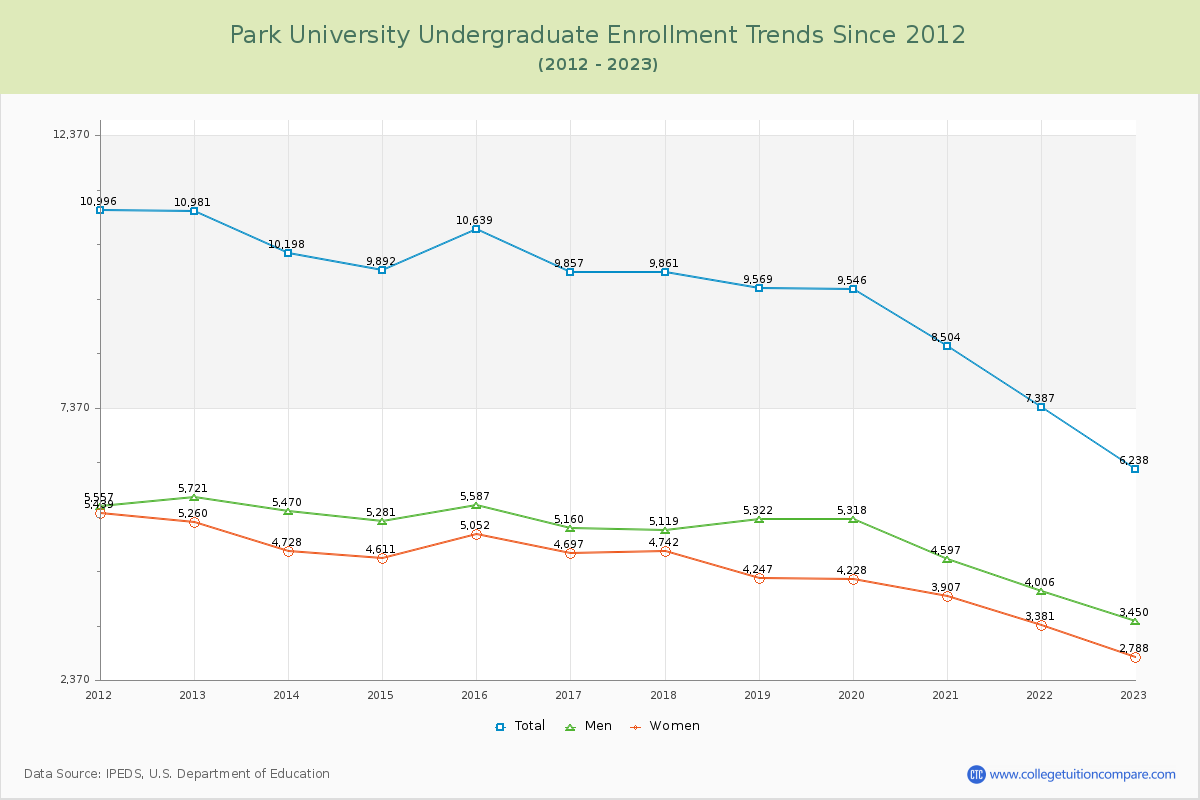
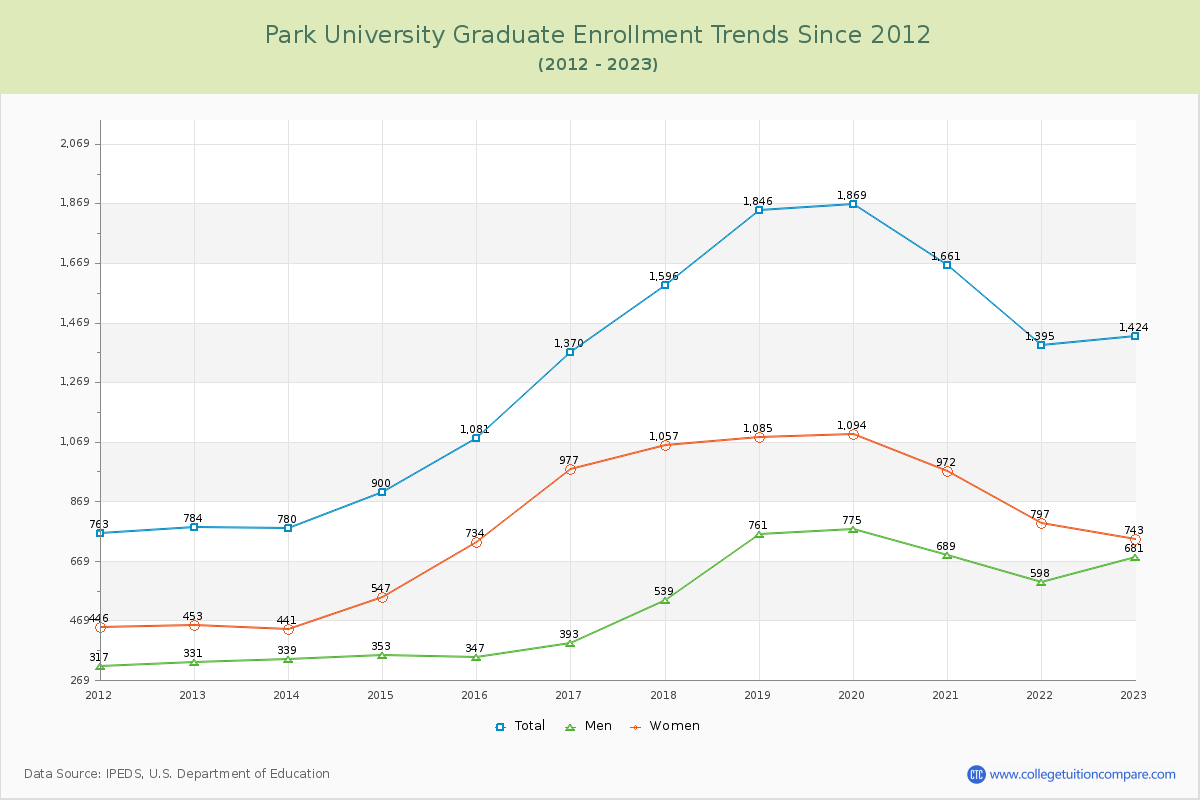
81.41% of total students is undergraduate students and 18.59% students is graduate students. The number of undergraduate students has decreased by 4,743 and the graduate enrollment has increased by 640 over past 10 years.
The female to male ratio is 0.85 to 1 and it means that there are slightly more male students enrolled in Park than female students.
The following table and chart illustrate the changes in student population by gender at Park University since 2012.
| Year | Total | Undergraduate | Graduate | ||||
|---|---|---|---|---|---|---|---|
| Total | Men | Women | Total | Men | Women | ||
| 2012-13 | 11,765 | 10,981 | 5,721 | 5,260 | 784 | 331 | 453 |
| 2013-14 | 10,978 -787 | 10,198 -783 | 5,470 -251 | 4,728 -532 | 780 -4 | 339 8 | 441 -12 |
| 2014-15 | 10,792 -186 | 9,892 -306 | 5,281 -189 | 4,611 -117 | 900 120 | 353 14 | 547 106 |
| 2015-16 | 11,720 928 | 10,639 747 | 5,587 306 | 5,052 441 | 1,081 181 | 347 -6 | 734 187 |
| 2016-17 | 11,227 -493 | 9,857 -782 | 5,160 -427 | 4,697 -355 | 1,370 289 | 393 46 | 977 243 |
| 2017-18 | 11,457 230 | 9,861 4 | 5,119 -41 | 4,742 45 | 1,596 226 | 539 146 | 1,057 80 |
| 2018-19 | 11,415 -42 | 9,569 -292 | 5,322 203 | 4,247 -495 | 1,846 250 | 761 222 | 1,085 28 |
| 2019-20 | 11,415 0 | 9,546 -23 | 5,318 -4 | 4,228 -19 | 1,869 23 | 775 14 | 1,094 9 |
| 2020-21 | 10,165 -1,250 | 8,504 -1,042 | 4,597 -721 | 3,907 -321 | 1,661 -208 | 689 -86 | 972 -122 |
| 2021-22 | 8,782 -1,383 | 7,387 -1,117 | 4,006 -591 | 3,381 -526 | 1,395 -266 | 598 -91 | 797 -175 |
| 2022-23 | 7,662 -1,120 | 6,238 -1,149 | 3,450 -556 | 2,788 -593 | 1,424 29 | 681 83 | 743 -54 |
| Average | 10,671 | 9,334 | 5,003 | 4,331 | 1,337 | 528 | 809 |