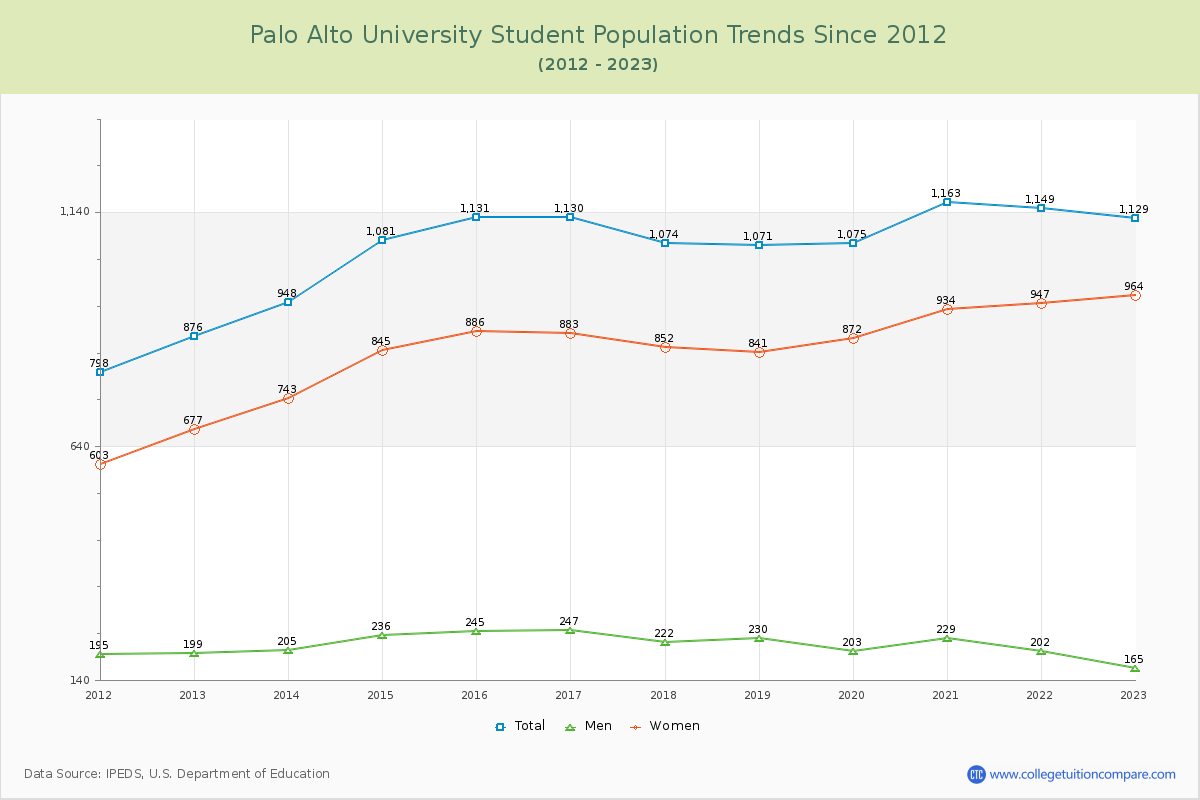
Student Population Changes
The average student population over the last 12 years is 1,075 where 1,129 students are attending the school for the academic year 2022-2023.
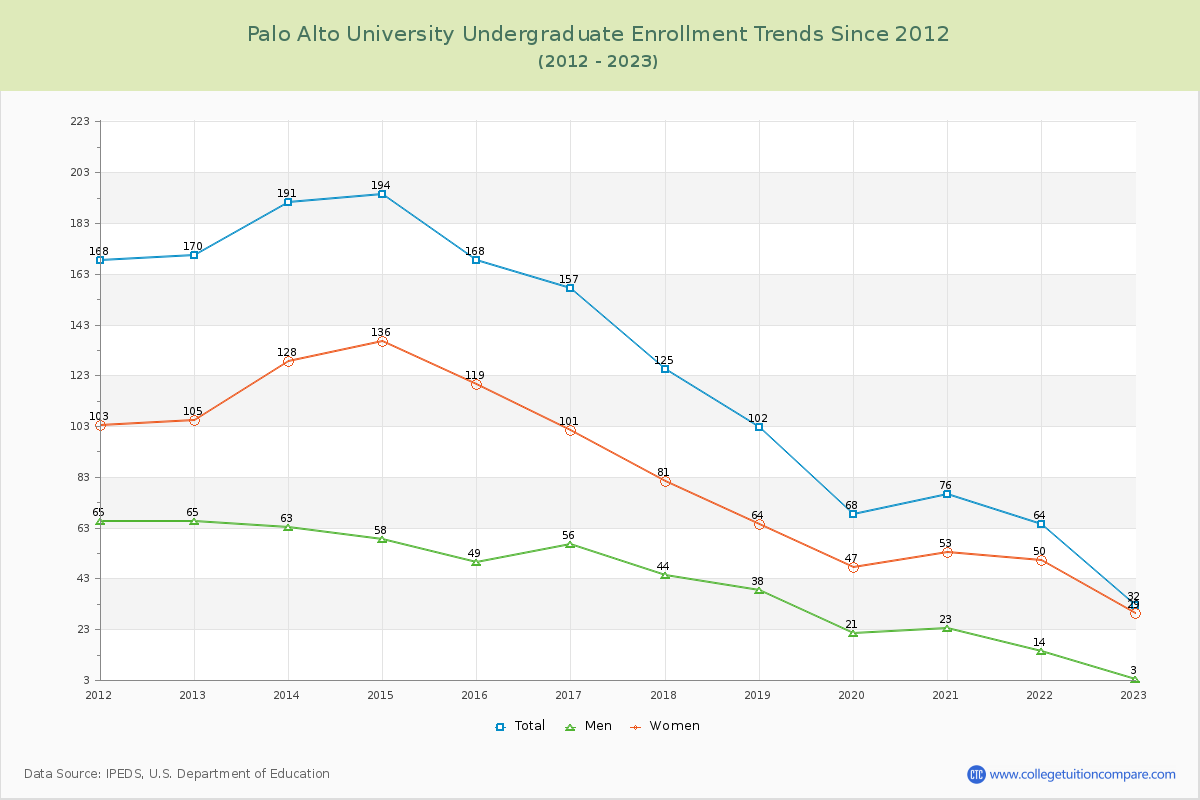
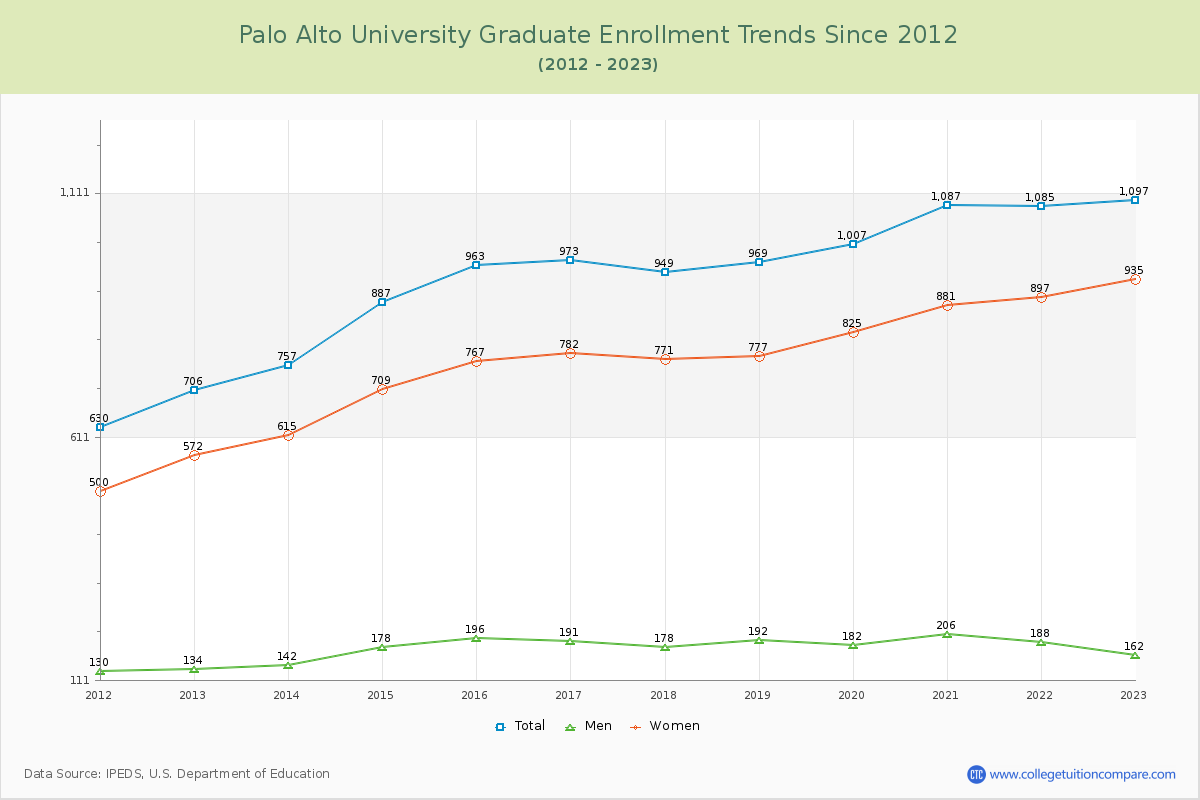
2.83% of total students is undergraduate students and 97.17% students is graduate students. The number of undergraduate students has decreased by 138 and the graduate enrollment has increased by 391 over past 10 years.
The female to male ratio is 5.84 to 1 and it means that there are far more female students enrolled in Palo Alto than male students.
The following table and chart illustrate the changes in student population by gender at Palo Alto University since 2012.
| Year | Total | Undergraduate | Graduate | ||||
|---|---|---|---|---|---|---|---|
| Total | Men | Women | Total | Men | Women | ||
| 2012-13 | 876 | 170 | 65 | 105 | 706 | 134 | 572 |
| 2013-14 | 948 72 | 191 21 | 63 -2 | 128 23 | 757 51 | 142 8 | 615 43 |
| 2014-15 | 1,081 133 | 194 3 | 58 -5 | 136 8 | 887 130 | 178 36 | 709 94 |
| 2015-16 | 1,131 50 | 168 -26 | 49 -9 | 119 -17 | 963 76 | 196 18 | 767 58 |
| 2016-17 | 1,130 -1 | 157 -11 | 56 7 | 101 -18 | 973 10 | 191 -5 | 782 15 |
| 2017-18 | 1,074 -56 | 125 -32 | 44 -12 | 81 -20 | 949 -24 | 178 -13 | 771 -11 |
| 2018-19 | 1,071 -3 | 102 -23 | 38 -6 | 64 -17 | 969 20 | 192 14 | 777 6 |
| 2019-20 | 1,075 4 | 68 -34 | 21 -17 | 47 -17 | 1,007 38 | 182 -10 | 825 48 |
| 2020-21 | 1,163 88 | 76 8 | 23 2 | 53 6 | 1,087 80 | 206 24 | 881 56 |
| 2021-22 | 1,149 -14 | 64 -12 | 14 -9 | 50 -3 | 1,085 -2 | 188 -18 | 897 16 |
| 2022-23 | 1,129 -20 | 32 -32 | 3 -11 | 29 -21 | 1,097 12 | 162 -26 | 935 38 |
| Average | 1,075 | 122 | 39 | 83 | 953 | 177 | 776 |