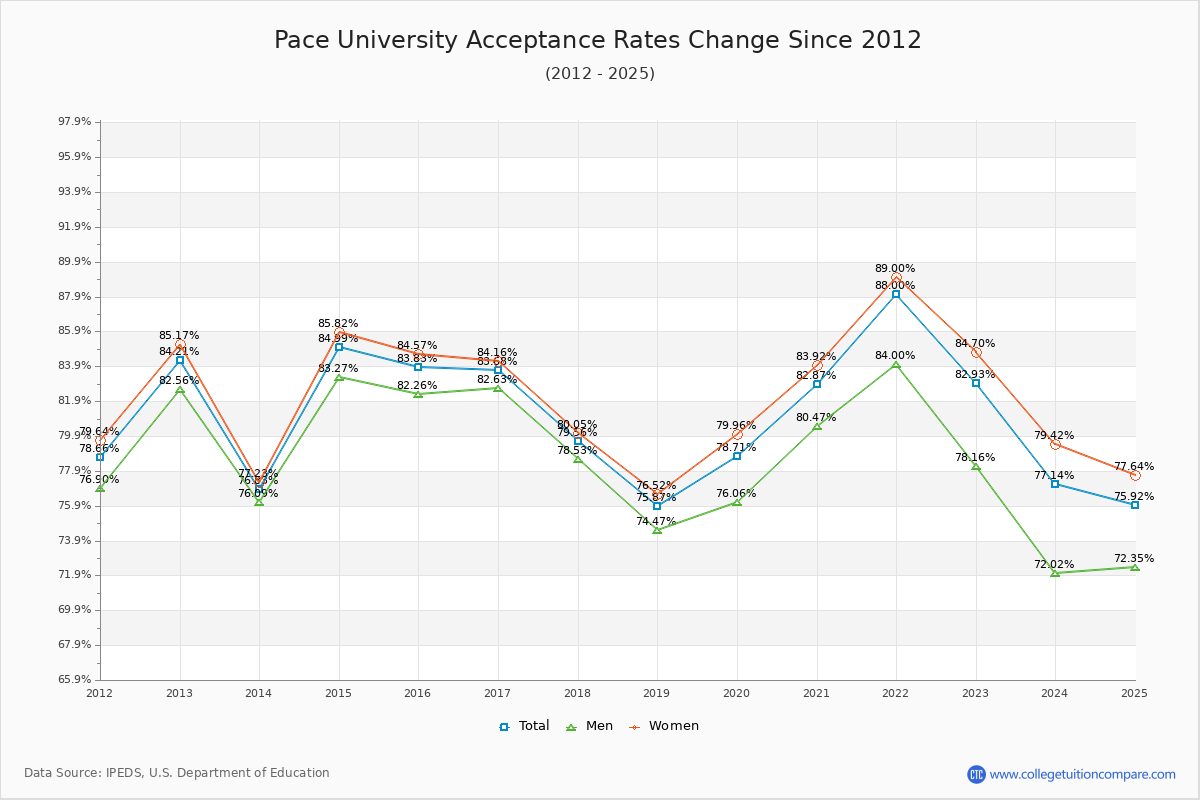
Acceptance Rate Changes
The average acceptance rate over the last 10 years is 81.95%, and this year's acceptance rate is 82.93% at Pace University. By gender, men students' acceptance rate is 79.86% and women students' rate is 82.83%. For 2023 admission, it was slightly harder to get into Pace University than the previous year.
The next table and chart illustrate the acceptance rates changes at Pace University over the past 11 years (2012-2023).
| Year | Total | Men | Women |
|---|---|---|---|
| 2012-13 | 84.21% | 82.56% | 85.17% |
| 2013-14 | 76.83% -7.37% |
76.09% -7.94% |
77.23% -7.94% |
| 2014-15 | 84.99% 8.16% |
83.27% 8.60% |
85.82% 8.60% |
| 2015-16 | 83.83% -1.16% |
82.26% -1.25% |
84.57% -1.25% |
| 2016-17 | 83.68% -0.15% |
82.63% -0.41% |
84.16% -0.41% |
| 2017-18 | 79.56% -4.12% |
78.53% -4.12% |
80.05% -4.12% |
| 2018-19 | 75.87% -3.69% |
74.47% -3.53% |
76.52% -3.53% |
| 2019-20 | 78.71% 2.84% |
76.06% 3.44% |
79.96% 3.44% |
| 2020-21 | 82.87% 4.16% |
80.47% 3.96% |
83.92% 3.96% |
| 2021-22 | 88.00% 5.13% |
84.00% 5.08% |
89.00% 5.08% |
| 2022-23 | 82.93% -5.07% |
78.16% -4.30% |
84.70% -4.30% |
| Average | 81.95% | 79.86% | 82.83% |