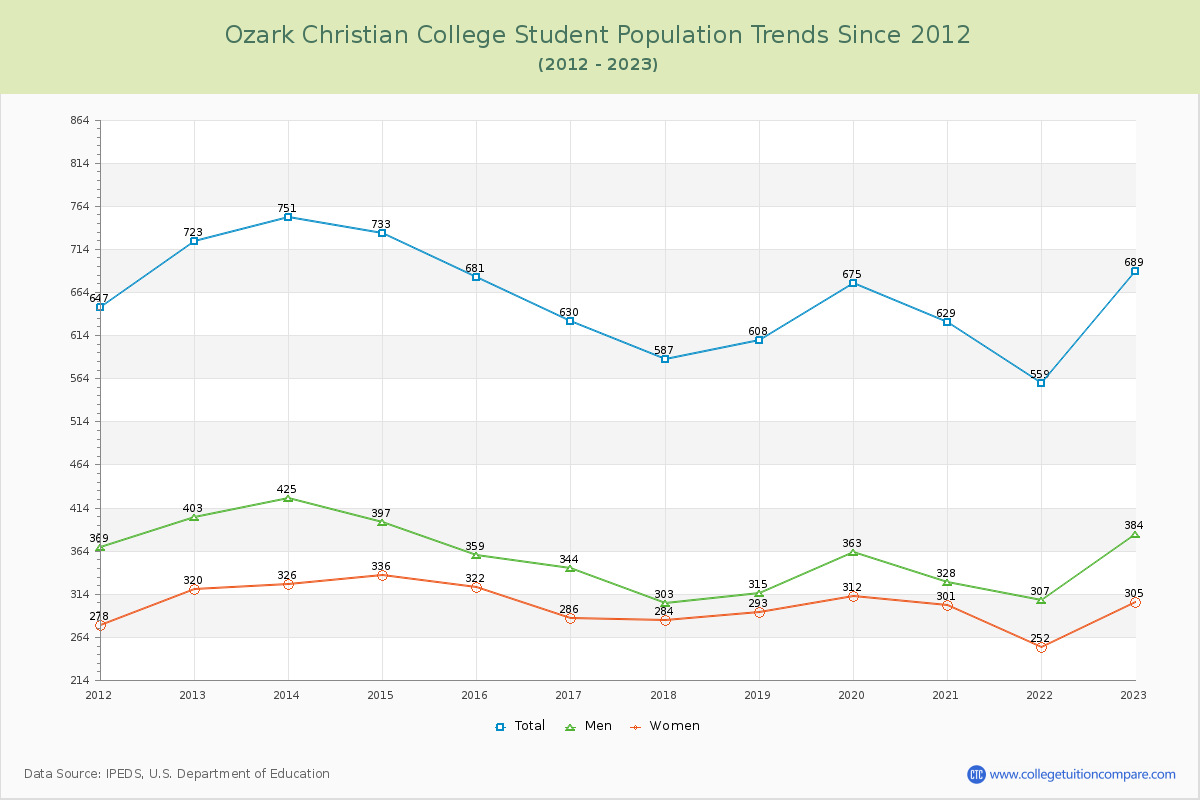
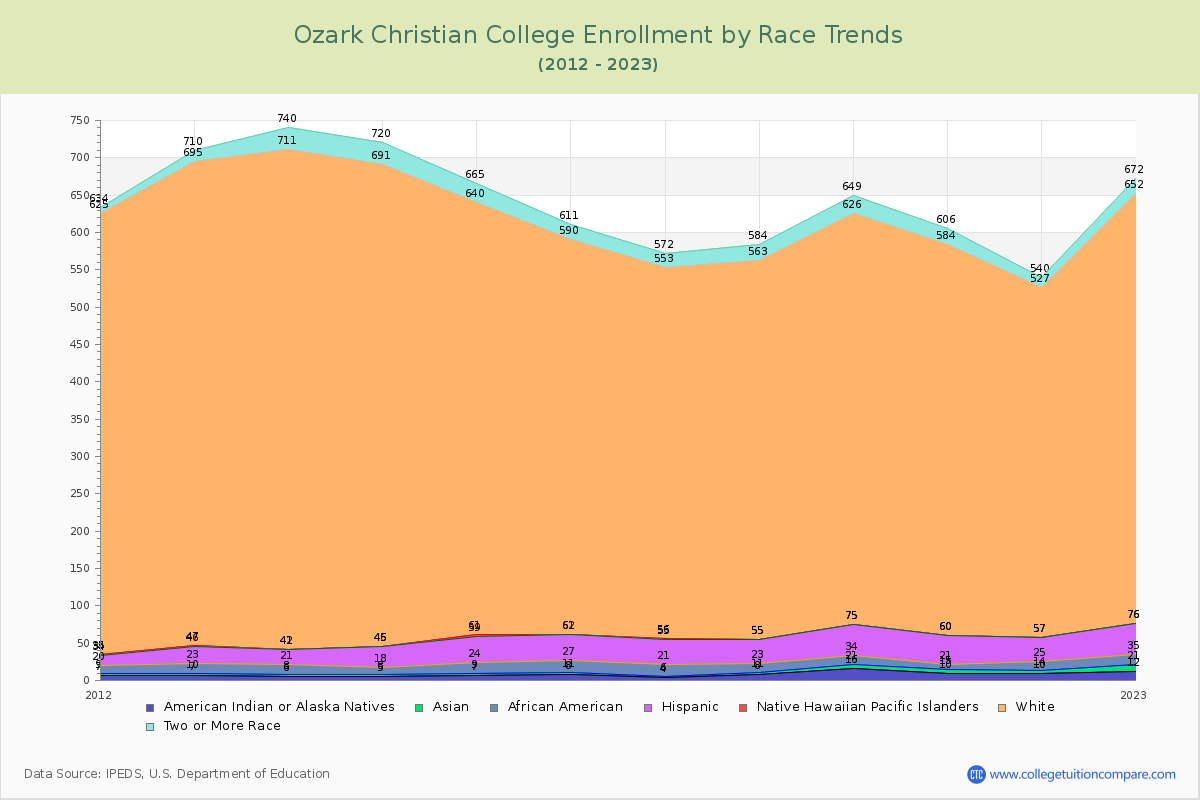
Student Population Changes
The average student population over the last 12 years is 660 where 689 students are attending the school for the academic year 2022-2023.
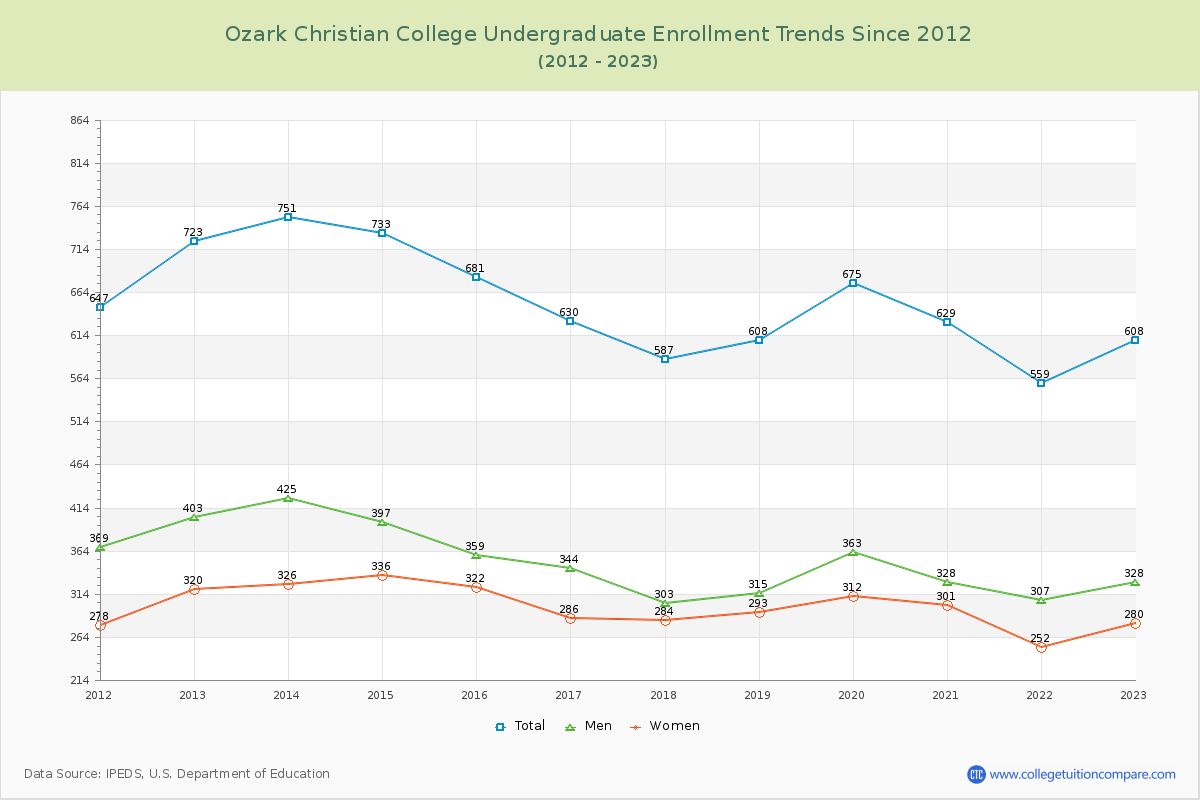
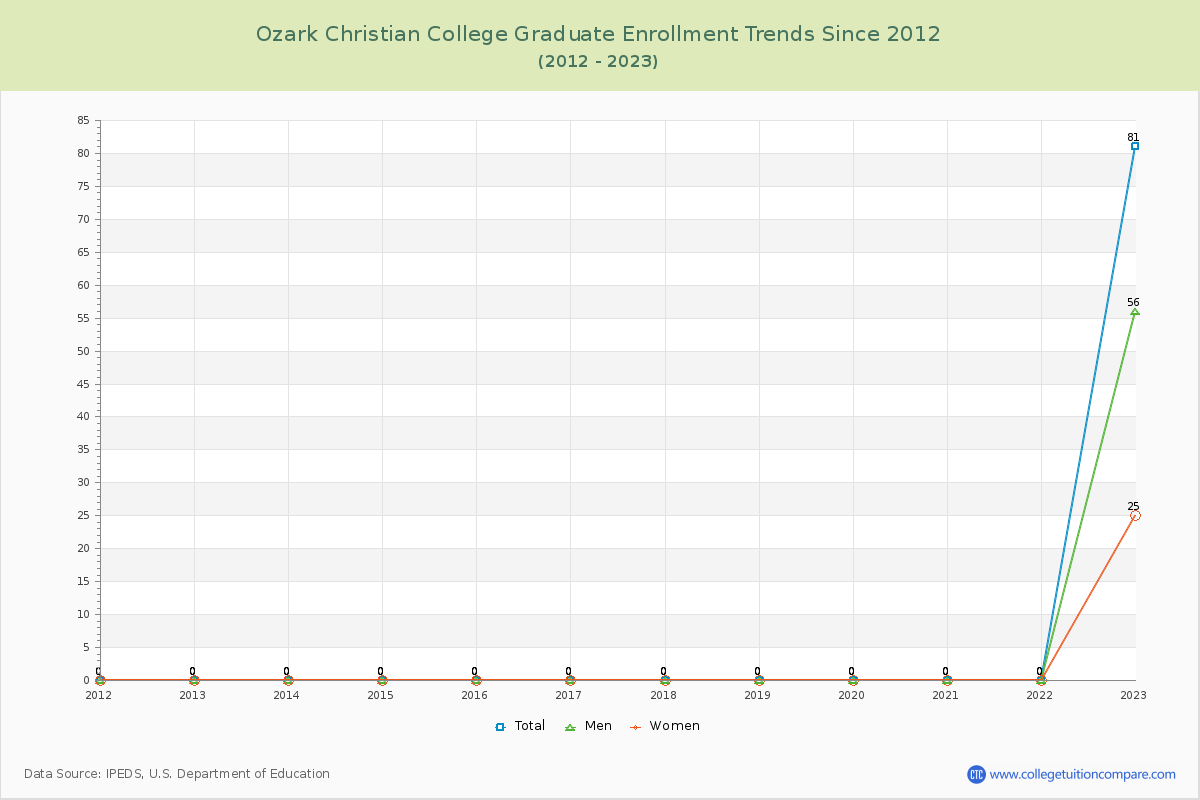
88.24% of total students is undergraduate students and 11.76% students is graduate students. The number of undergraduate students has decreased by 115 and the graduate enrollment has increased by 81 over past 10 years.
The female to male ratio is 0.79 to 1 and it means that there are more male students enrolled in Ozark Christian than female students.
The following table and chart illustrate the changes in student population by gender at Ozark Christian College since 2012.
| Year | Total | Undergraduate | Graduate | ||||
|---|---|---|---|---|---|---|---|
| Total | Men | Women | Total | Men | Women | ||
| 2012-13 | 723 | 723 | 403 | 320 | 0 | 0 | 0 |
| 2013-14 | 751 28 | 751 28 | 425 22 | 326 6 | 0 0 | 0 0 | 0 0 |
| 2014-15 | 733 -18 | 733 -18 | 397 -28 | 336 10 | 0 0 | 0 0 | 0 0 |
| 2015-16 | 681 -52 | 681 -52 | 359 -38 | 322 -14 | 0 0 | 0 0 | 0 0 |
| 2016-17 | 630 -51 | 630 -51 | 344 -15 | 286 -36 | 0 0 | 0 0 | 0 0 |
| 2017-18 | 587 -43 | 587 -43 | 303 -41 | 284 -2 | 0 0 | 0 0 | 0 0 |
| 2018-19 | 608 21 | 608 21 | 315 12 | 293 9 | 0 0 | 0 0 | 0 0 |
| 2019-20 | 675 67 | 675 67 | 363 48 | 312 19 | 0 0 | 0 0 | 0 0 |
| 2020-21 | 629 -46 | 629 -46 | 328 -35 | 301 -11 | 0 0 | 0 0 | 0 0 |
| 2021-22 | 559 -70 | 559 -70 | 307 -21 | 252 -49 | 0 0 | 0 0 | 0 0 |
| 2022-23 | 689 130 | 608 49 | 328 21 | 280 28 | 81 81 | 56 56 | 25 25 |
| Average | 660 | 653 | 352 | 301 | 7 | 5 | 2 |