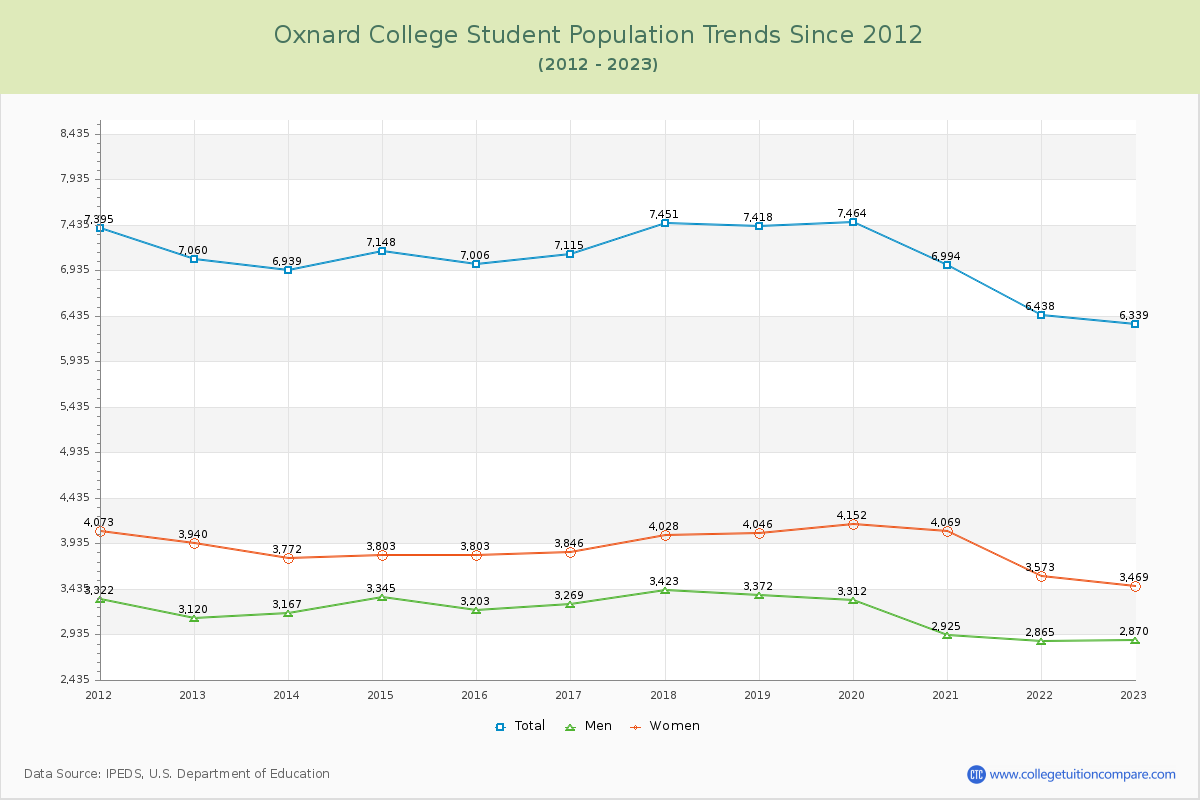
Student Population Changes
The average student population over the last 12 years is 7,034 where 6,339 students are attending the school for the academic year 2022-2023.
The female to male ratio is 1.21 to 1 and it means that there are slightly more female students enrolled in Oxnard than male students.
The following table and chart illustrate the changes in student population by gender at Oxnard College since 2012.
| Year | Total | Men | Women |
|---|---|---|---|
| 2012-13 | 7,060 | 3,120 | 3,940 |
| 2013-14 | 6,939 -121 | 3,167 47 | 3,772 -168 |
| 2014-15 | 7,148 209 | 3,345 178 | 3,803 31 |
| 2015-16 | 7,006 -142 | 3,203 -142 | 3,803 0 |
| 2016-17 | 7,115 109 | 3,269 66 | 3,846 43 |
| 2017-18 | 7,451 336 | 3,423 154 | 4,028 182 |
| 2018-19 | 7,418 -33 | 3,372 -51 | 4,046 18 |
| 2019-20 | 7,464 46 | 3,312 -60 | 4,152 106 |
| 2020-21 | 6,994 -470 | 2,925 -387 | 4,069 -83 |
| 2021-22 | 6,438 -556 | 2,865 -60 | 3,573 -496 |
| 2022-23 | 6,339 -99 | 2,870 5 | 3,469 -104 |
| Average | 7,034 | 3,170 | 3,864 |