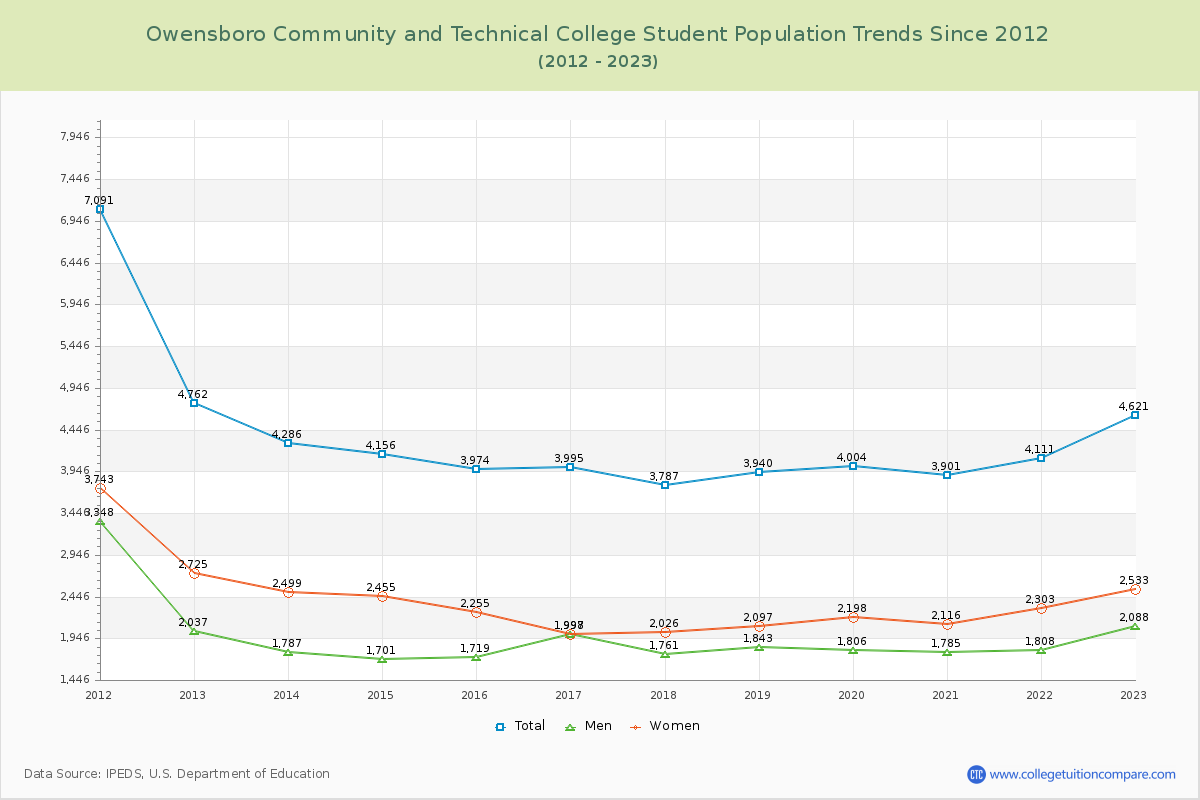
Student Population Changes
The average student population over the last 12 years is 4,140 where 4,621 students are attending the school for the academic year 2022-2023.
The female to male ratio is 1.21 to 1 and it means that there are slightly more female students enrolled in Owensboro Community and Technical than male students.
The following table and chart illustrate the changes in student population by gender at Owensboro Community and Technical College since 2012.
| Year | Total | Men | Women |
|---|---|---|---|
| 2012-13 | 4,762 | 2,037 | 2,725 |
| 2013-14 | 4,286 -476 | 1,787 -250 | 2,499 -226 |
| 2014-15 | 4,156 -130 | 1,701 -86 | 2,455 -44 |
| 2015-16 | 3,974 -182 | 1,719 18 | 2,255 -200 |
| 2016-17 | 3,995 21 | 1,998 279 | 1,997 -258 |
| 2017-18 | 3,787 -208 | 1,761 -237 | 2,026 29 |
| 2018-19 | 3,940 153 | 1,843 82 | 2,097 71 |
| 2019-20 | 4,004 64 | 1,806 -37 | 2,198 101 |
| 2020-21 | 3,901 -103 | 1,785 -21 | 2,116 -82 |
| 2021-22 | 4,111 210 | 1,808 23 | 2,303 187 |
| 2022-23 | 4,621 510 | 2,088 280 | 2,533 230 |
| Average | 4,140 | 1,848 | 2,291 |