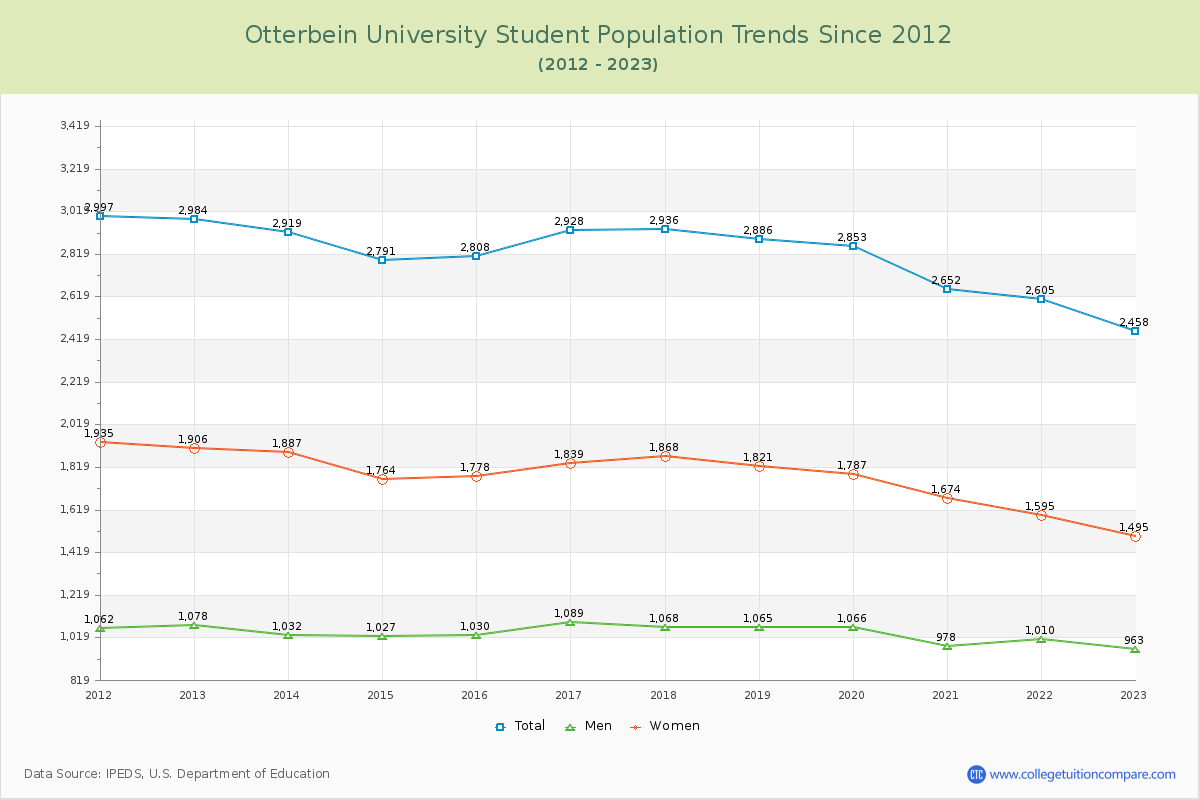
Student Population Changes
The average student population over the last 12 years is 2,802 where 2,458 students are attending the school for the academic year 2022-2023.
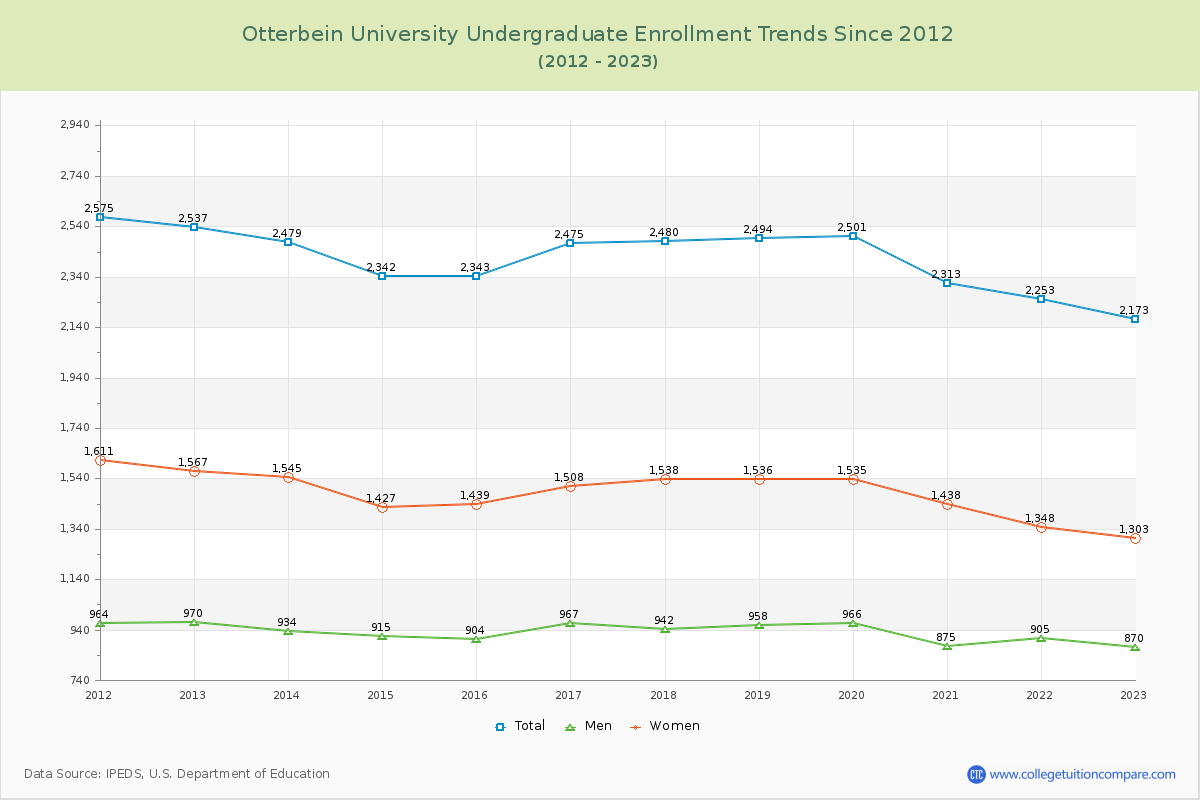
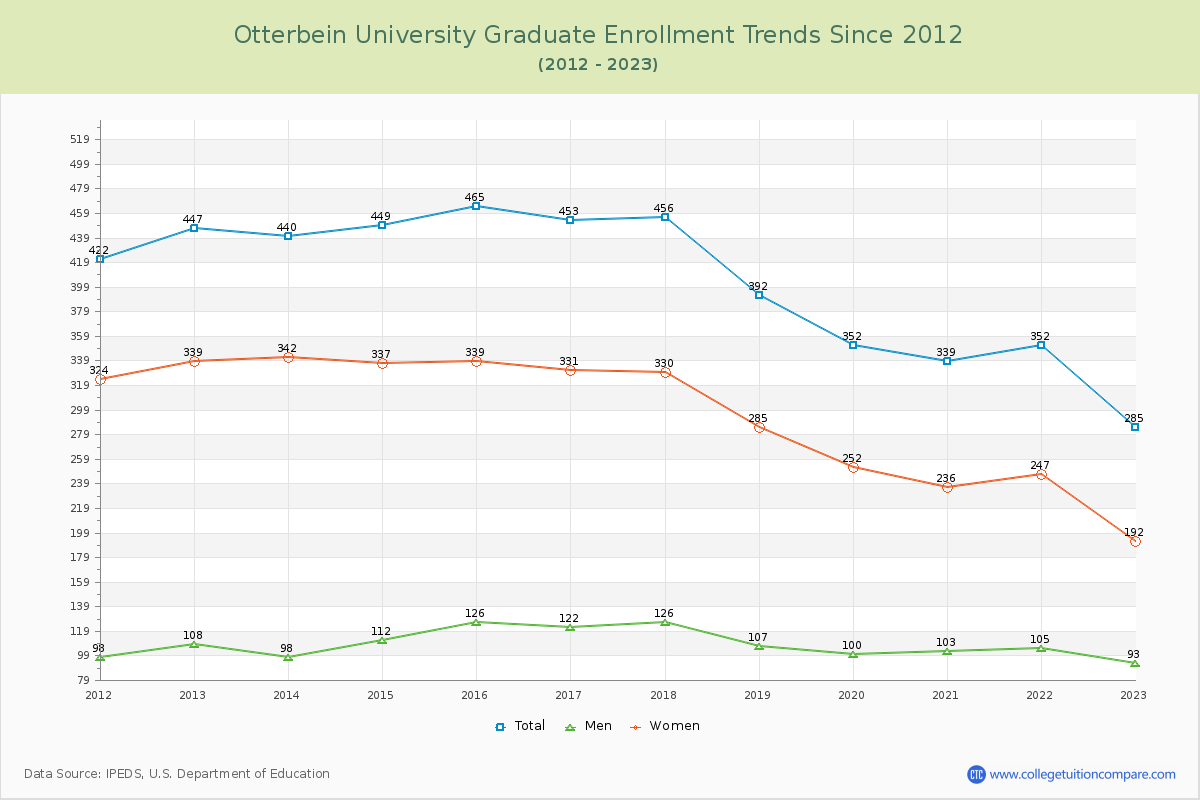
88.41% of total students is undergraduate students and 11.59% students is graduate students. The number of undergraduate students has decreased by 364 and the graduate enrollment has decreased by 162 over past 10 years.
The female to male ratio is 1.55 to 1 and it means that there are more female students enrolled in Otterbein than male students.
The following table and chart illustrate the changes in student population by gender at Otterbein University since 2012.
| Year | Total | Undergraduate | Graduate | ||||
|---|---|---|---|---|---|---|---|
| Total | Men | Women | Total | Men | Women | ||
| 2012-13 | 2,984 | 2,537 | 970 | 1,567 | 447 | 108 | 339 |
| 2013-14 | 2,919 -65 | 2,479 -58 | 934 -36 | 1,545 -22 | 440 -7 | 98 -10 | 342 3 |
| 2014-15 | 2,791 -128 | 2,342 -137 | 915 -19 | 1,427 -118 | 449 9 | 112 14 | 337 -5 |
| 2015-16 | 2,808 17 | 2,343 1 | 904 -11 | 1,439 12 | 465 16 | 126 14 | 339 2 |
| 2016-17 | 2,928 120 | 2,475 132 | 967 63 | 1,508 69 | 453 -12 | 122 -4 | 331 -8 |
| 2017-18 | 2,936 8 | 2,480 5 | 942 -25 | 1,538 30 | 456 3 | 126 4 | 330 -1 |
| 2018-19 | 2,886 -50 | 2,494 14 | 958 16 | 1,536 -2 | 392 -64 | 107 -19 | 285 -45 |
| 2019-20 | 2,853 -33 | 2,501 7 | 966 8 | 1,535 -1 | 352 -40 | 100 -7 | 252 -33 |
| 2020-21 | 2,652 -201 | 2,313 -188 | 875 -91 | 1,438 -97 | 339 -13 | 103 3 | 236 -16 |
| 2021-22 | 2,605 -47 | 2,253 -60 | 905 30 | 1,348 -90 | 352 13 | 105 2 | 247 11 |
| 2022-23 | 2,458 -147 | 2,173 -80 | 870 -35 | 1,303 -45 | 285 -67 | 93 -12 | 192 -55 |
| Average | 2,802 | 2,399 | 928 | 1,471 | 403 | 109 | 294 |