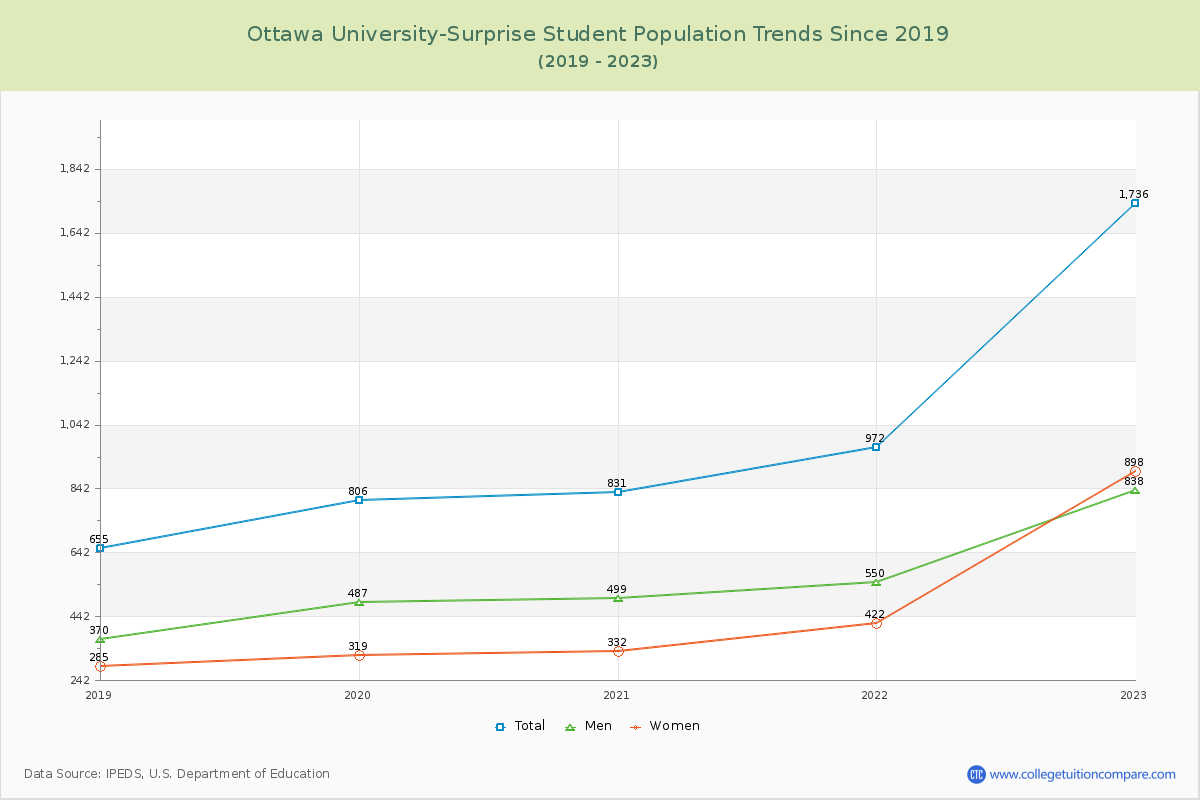
Student Population Changes
The average student population over the last 6 years is 1,000 where 1,736 students are attending the school for the academic year 2022-2023.
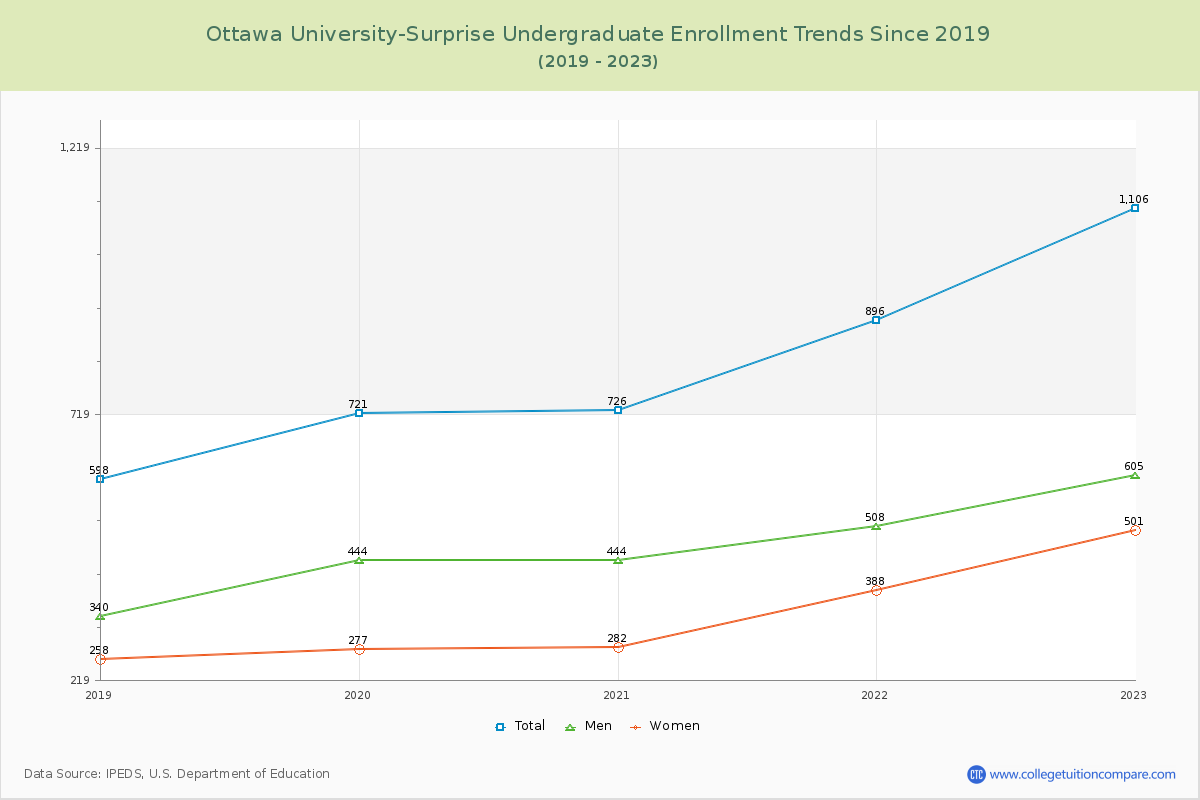
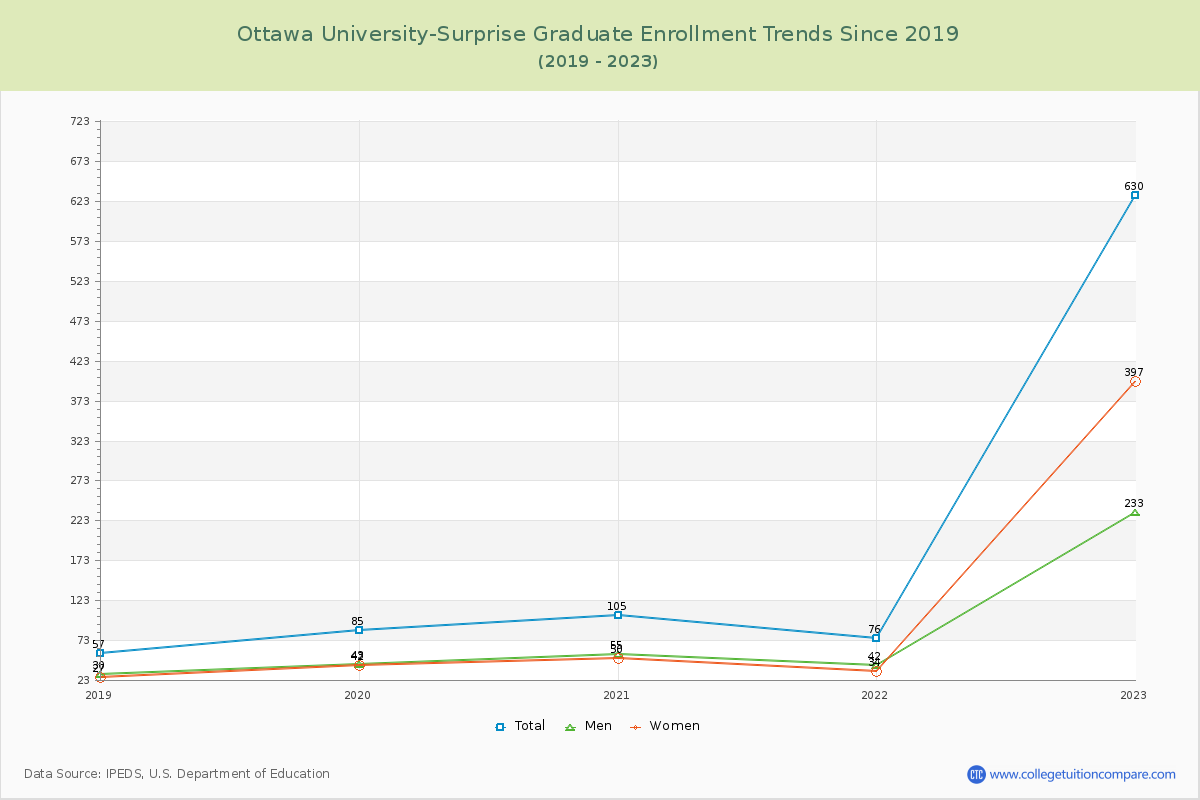
63.71% of total students is undergraduate students and 36.29% students is graduate students. The number of undergraduate students has increased by 508 and the graduate enrollment has increased by 573 over past 10 years.
The female to male ratio is 1.07 to 1 and it means that there are similar numbers of female and male students enrolled in Ottawa University-Surprise.
The following table and chart illustrate the changes in student population by gender at Ottawa University-Surprise since 2018.
| Year | Total | Undergraduate | Graduate | ||||
|---|---|---|---|---|---|---|---|
| Total | Men | Women | Total | Men | Women | ||
| 2018-19 | 655 | 598 | 340 | 258 | 57 | 30 | 27 |
| 2019-20 | 806 151 | 721 123 | 444 104 | 277 19 | 85 28 | 43 13 | 42 15 |
| 2020-21 | 831 25 | 726 5 | 444 0 | 282 5 | 105 20 | 55 12 | 50 8 |
| 2021-22 | 972 141 | 896 170 | 508 64 | 388 106 | 76 -29 | 42 -13 | 34 -16 |
| 2022-23 | 1,736 764 | 1,106 210 | 605 97 | 501 113 | 630 554 | 233 191 | 397 363 |
| Average | 1,000 | 809 | 468 | 341 | 191 | 81 | 110 |