Student Population Changes
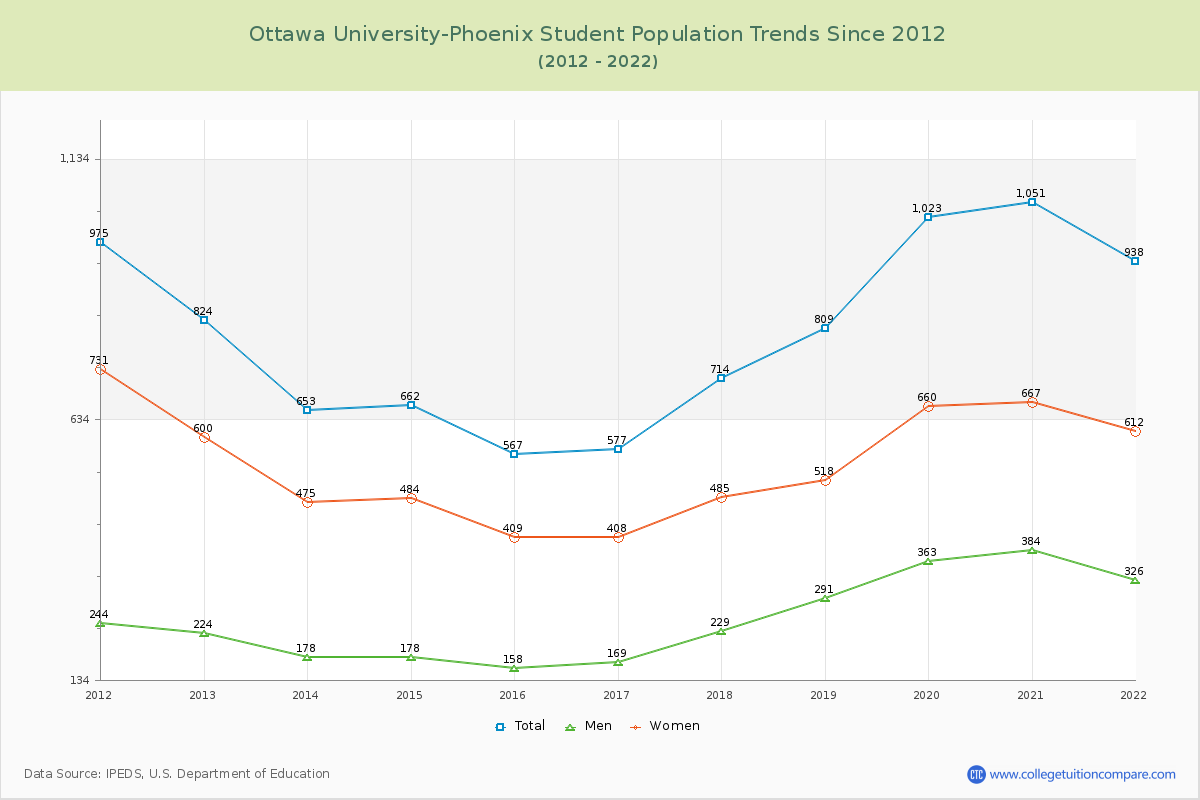
The average student population over the last 11 years is 782 where 938 students are attending the school for the academic year 2021-2022.
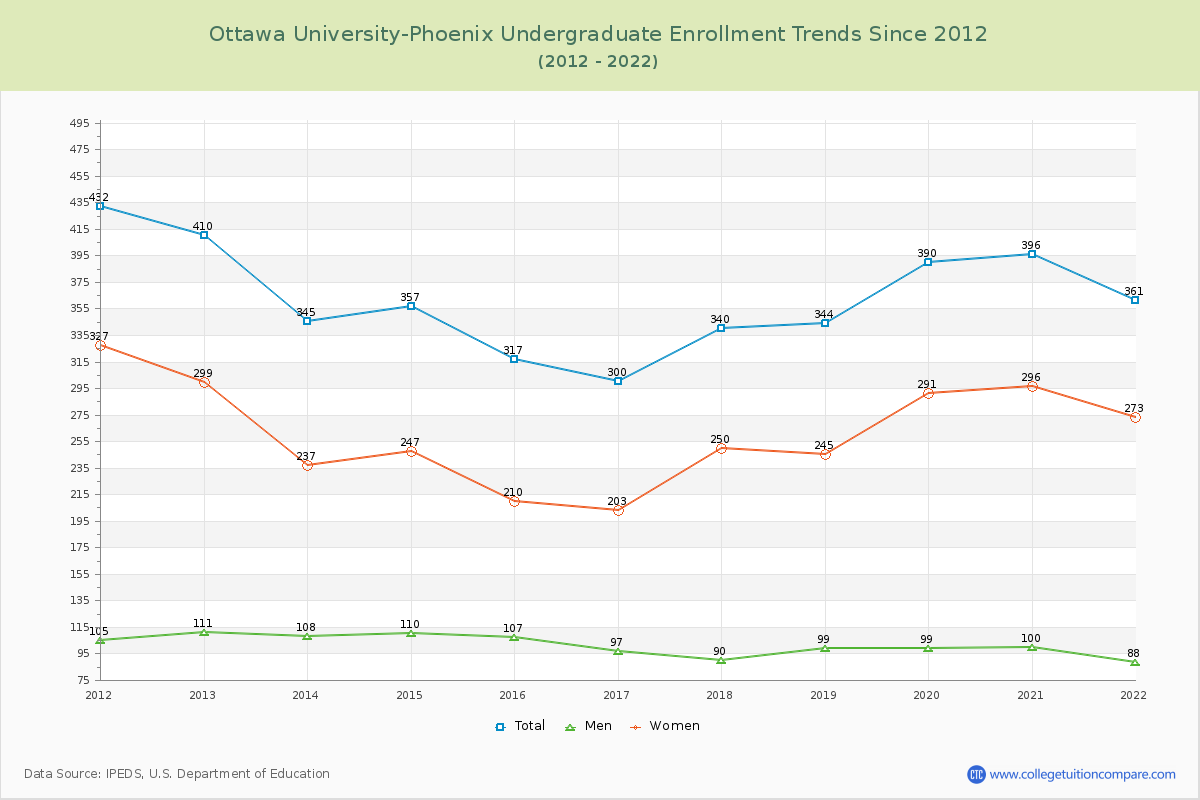
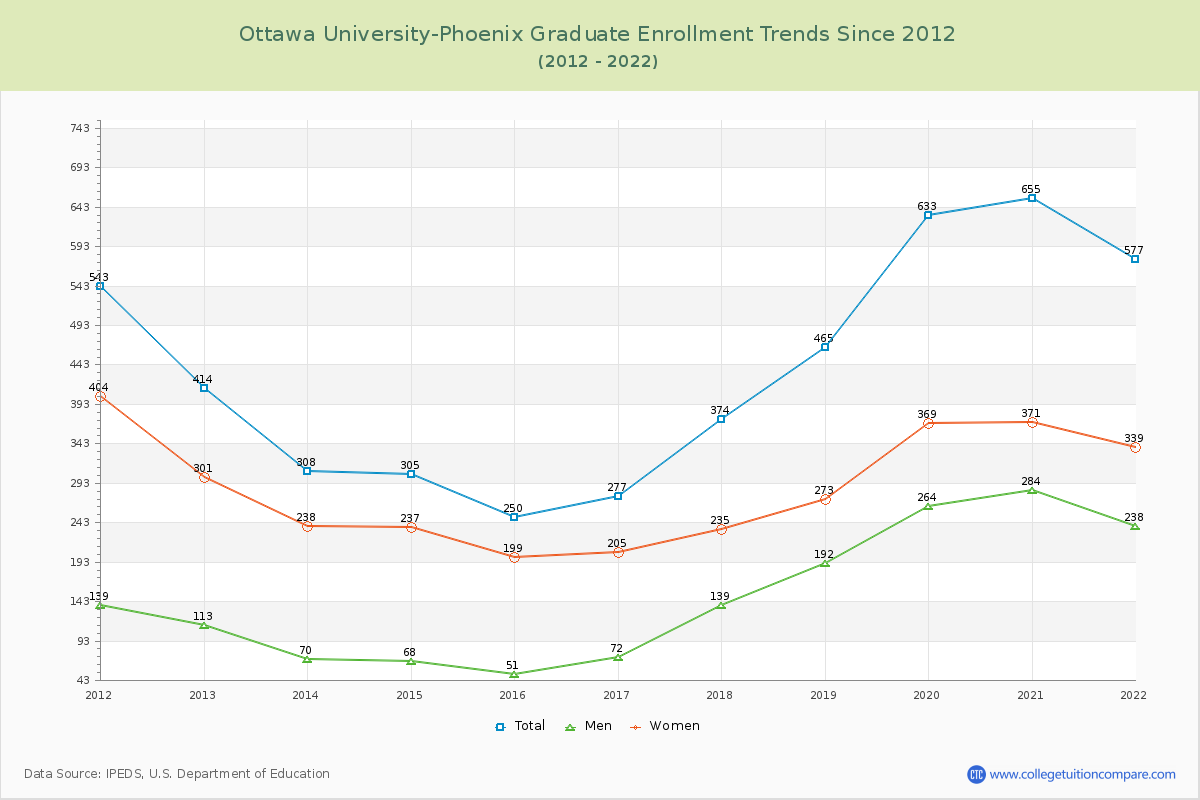
38.49% of total students is undergraduate students and 61.51% students is graduate students. The number of undergraduate students has decreased by 49 and the graduate enrollment has increased by 163 over past 10 years.
The female to male ratio is 1.88 to 1 and it means that there are more female students enrolled in OUAZ than male students.
The following table and chart illustrate the changes in student population by gender at Ottawa University-Phoenix since 2012.
| Year | Total | Undergraduate | Graduate | ||||
|---|---|---|---|---|---|---|---|
| Total | Men | Women | Total | Men | Women | ||
| 2012-13 | 824 | 410 | 111 | 299 | 414 | 113 | 301 |
| 2013-14 | 653 -171 | 345 -65 | 108 -3 | 237 -62 | 308 -106 | 70 -43 | 238 -63 |
| 2014-15 | 662 9 | 357 12 | 110 2 | 247 10 | 305 -3 | 68 -2 | 237 -1 |
| 2015-16 | 567 -95 | 317 -40 | 107 -3 | 210 -37 | 250 -55 | 51 -17 | 199 -38 |
| 2016-17 | 577 10 | 300 -17 | 97 -10 | 203 -7 | 277 27 | 72 21 | 205 6 |
| 2017-18 | 714 137 | 340 40 | 90 -7 | 250 47 | 374 97 | 139 67 | 235 30 |
| 2018-19 | 809 95 | 344 4 | 99 9 | 245 -5 | 465 91 | 192 53 | 273 38 |
| 2019-20 | 1,023 214 | 390 46 | 99 0 | 291 46 | 633 168 | 264 72 | 369 96 |
| 2020-21 | 1,051 28 | 396 6 | 100 1 | 296 5 | 655 22 | 284 20 | 371 2 |
| 2021-22 | 938 -113 | 361 -35 | 88 -12 | 273 -23 | 577 -78 | 238 -46 | 339 -32 |
| Average | 782 | 356 | 101 | 255 | 426 | 149 | 277 |