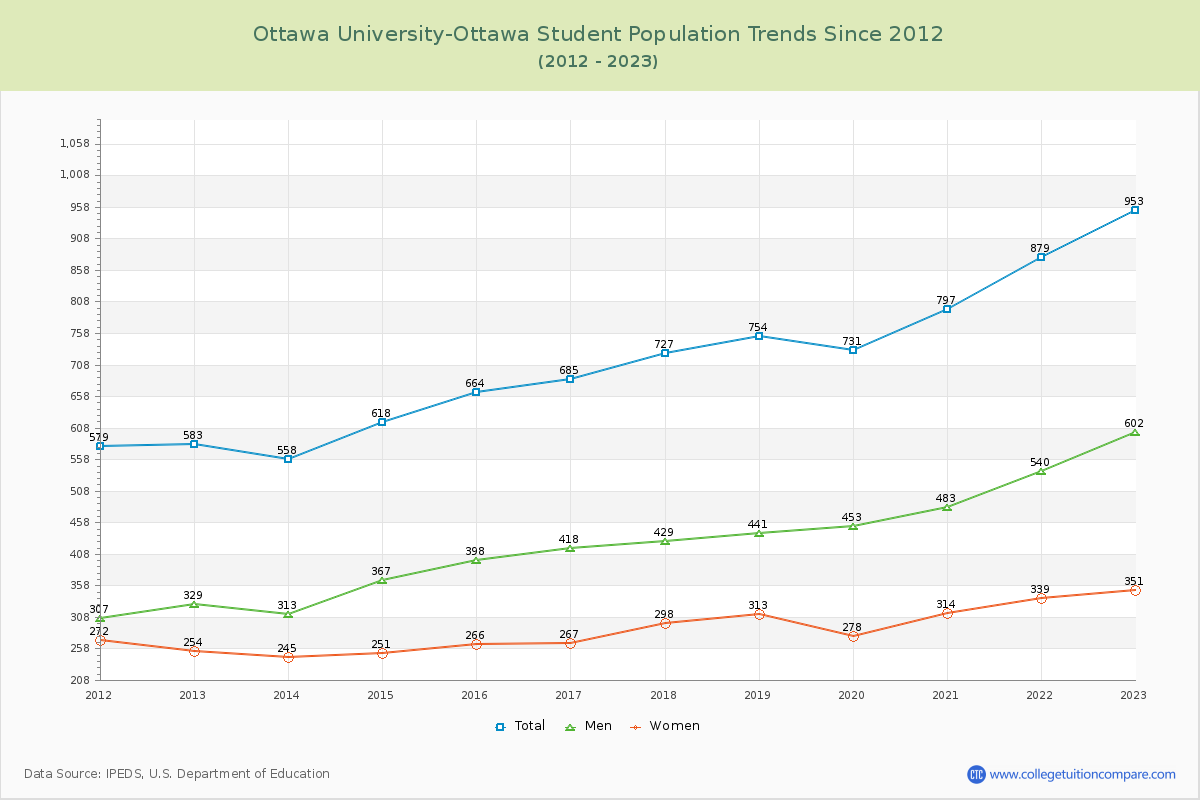
Student Population Changes
The average student population over the last 12 years is 723 where 953 students are attending the school for the academic year 2022-2023.
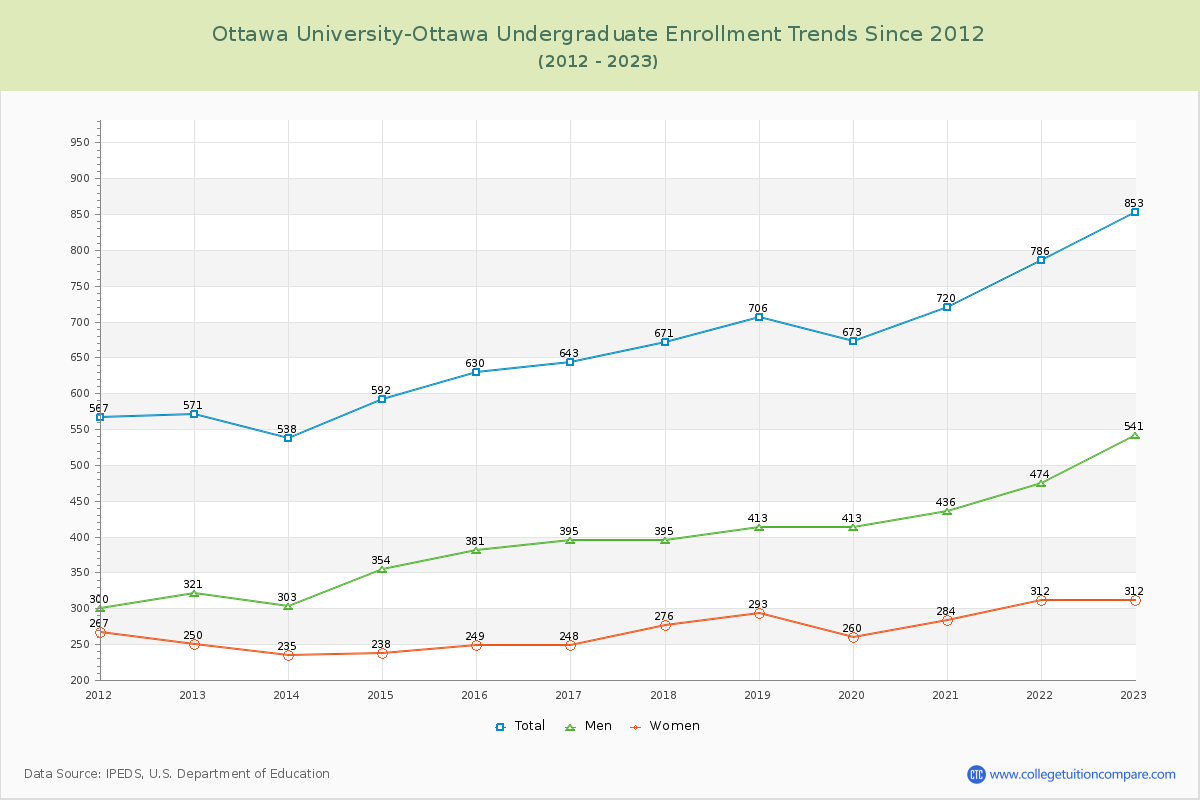
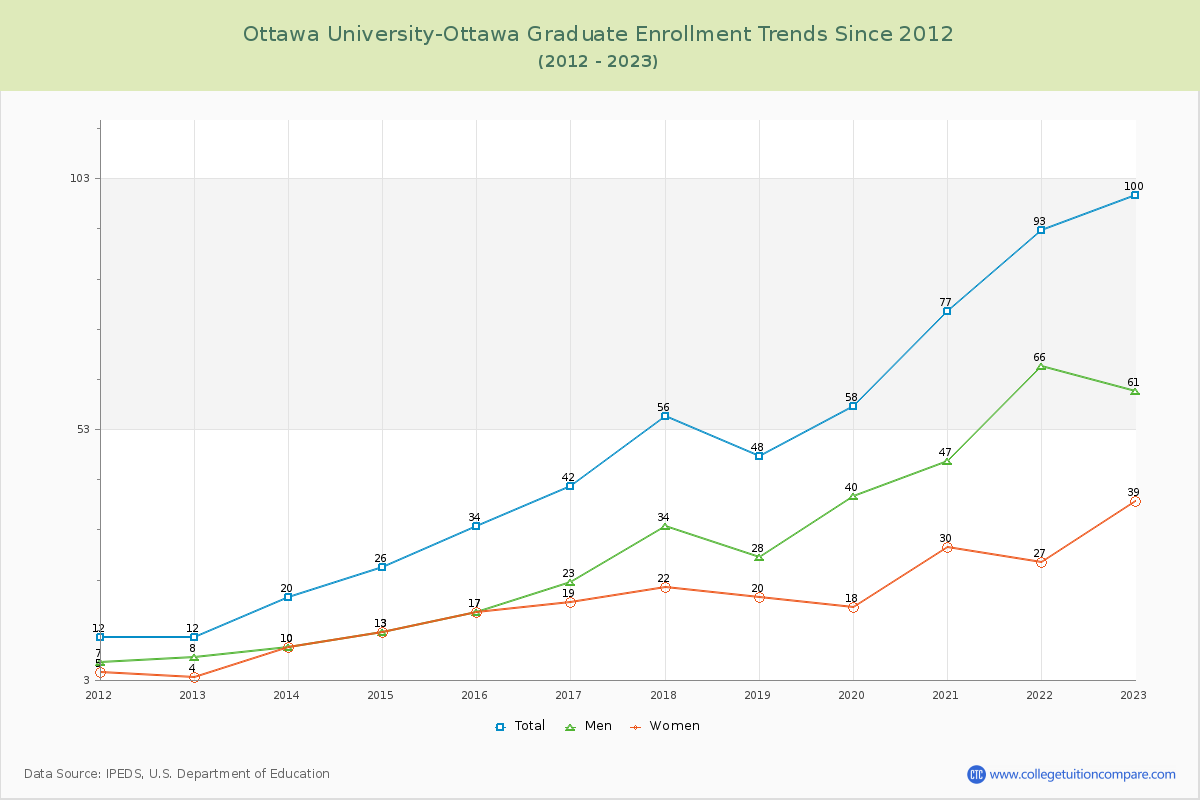
89.51% of total students is undergraduate students and 10.49% students is graduate students. The number of undergraduate students has increased by 282 and the graduate enrollment has increased by 88 over past 10 years.
The female to male ratio is 0.58 to 1 and it means that there are more male students enrolled in OU than female students.
The following table and chart illustrate the changes in student population by gender at Ottawa University-Ottawa since 2012.
| Year | Total | Undergraduate | Graduate | ||||
|---|---|---|---|---|---|---|---|
| Total | Men | Women | Total | Men | Women | ||
| 2012-13 | 583 | 571 | 321 | 250 | 12 | 8 | 4 |
| 2013-14 | 558 -25 | 538 -33 | 303 -18 | 235 -15 | 20 8 | 10 2 | 10 6 |
| 2014-15 | 618 60 | 592 54 | 354 51 | 238 3 | 26 6 | 13 3 | 13 3 |
| 2015-16 | 664 46 | 630 38 | 381 27 | 249 11 | 34 8 | 17 4 | 17 4 |
| 2016-17 | 685 21 | 643 13 | 395 14 | 248 -1 | 42 8 | 23 6 | 19 2 |
| 2017-18 | 727 42 | 671 28 | 395 0 | 276 28 | 56 14 | 34 11 | 22 3 |
| 2018-19 | 754 27 | 706 35 | 413 18 | 293 17 | 48 -8 | 28 -6 | 20 -2 |
| 2019-20 | 731 -23 | 673 -33 | 413 0 | 260 -33 | 58 10 | 40 12 | 18 -2 |
| 2020-21 | 797 66 | 720 47 | 436 23 | 284 24 | 77 19 | 47 7 | 30 12 |
| 2021-22 | 879 82 | 786 66 | 474 38 | 312 28 | 93 16 | 66 19 | 27 -3 |
| 2022-23 | 953 74 | 853 67 | 541 67 | 312 0 | 100 7 | 61 -5 | 39 12 |
| Average | 723 | 671 | 402 | 269 | 51 | 32 | 20 |