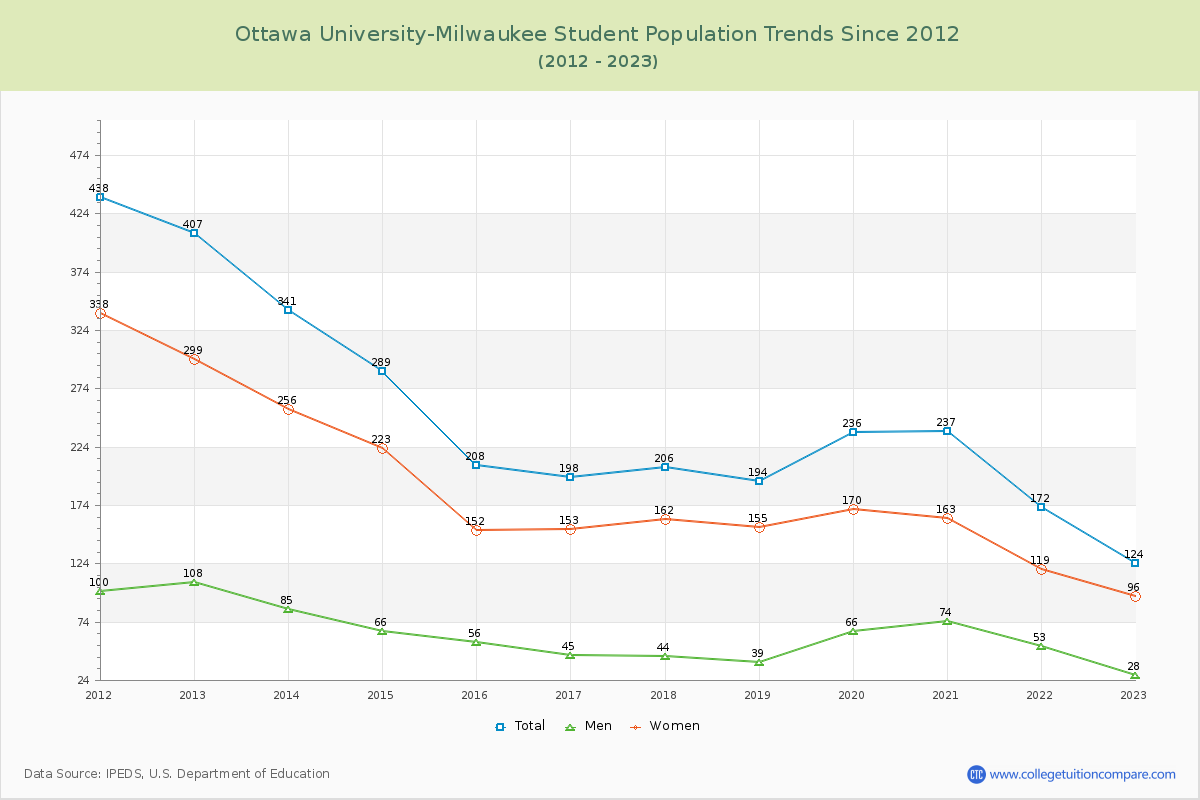
Student Population Changes
The average student population over the last 12 years is 237 where 124 students are attending the school for the academic year 2022-2023.
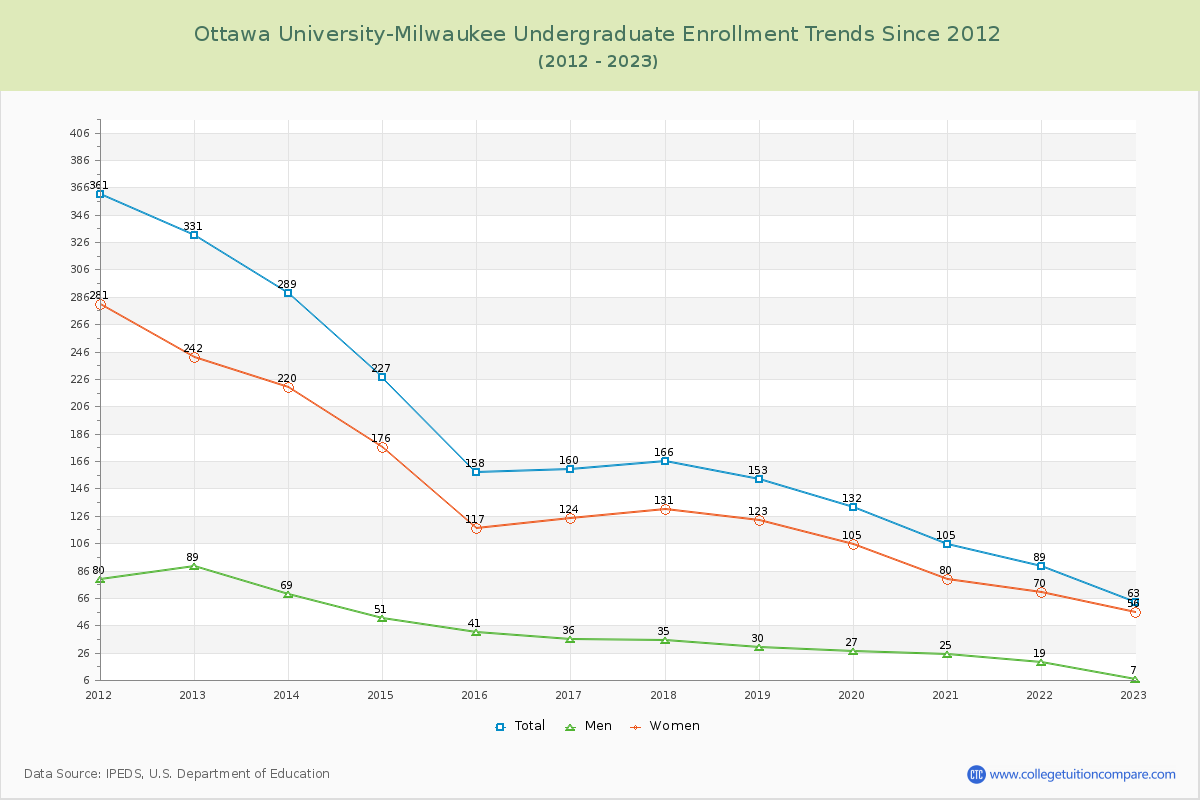
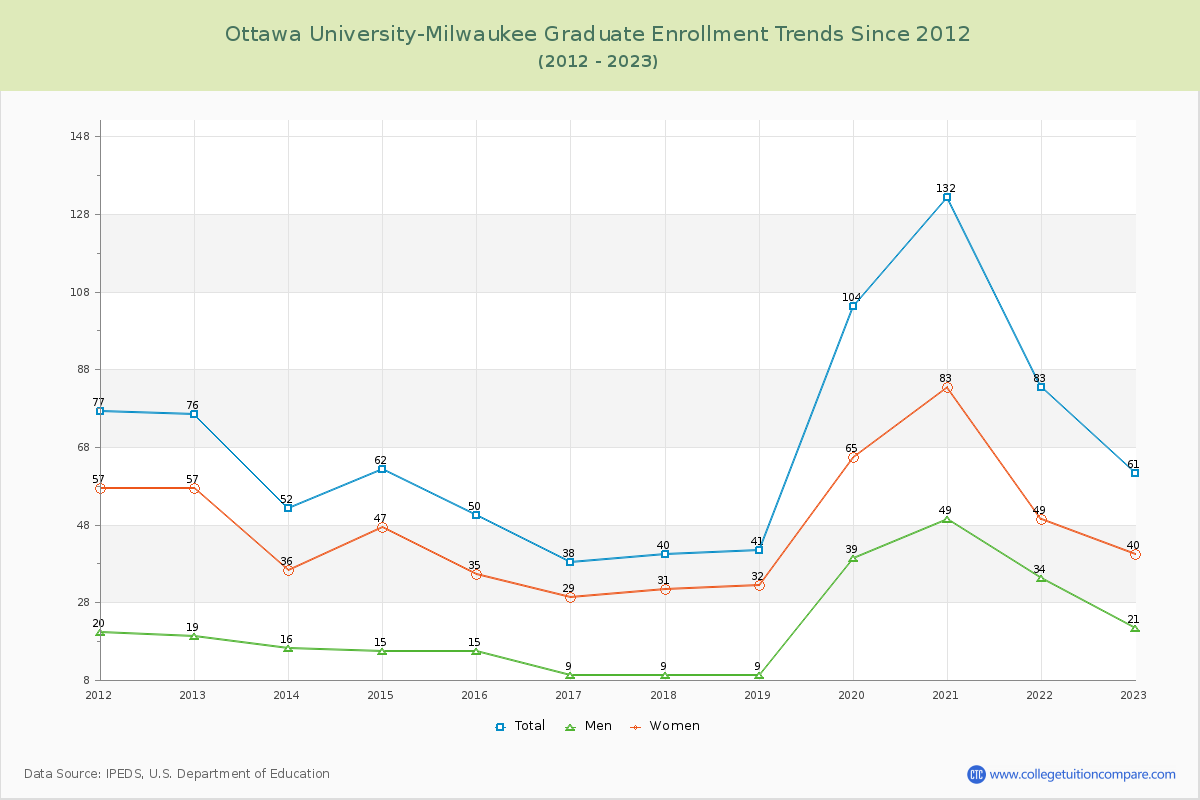
50.81% of total students is undergraduate students and 49.19% students is graduate students. The number of undergraduate students has decreased by 268 and the graduate enrollment has decreased by 15 over past 10 years.
The female to male ratio is 3.43 to 1 and it means that there are far more female students enrolled in OU-Milwaukee than male students.
The following table and chart illustrate the changes in student population by gender at Ottawa University-Milwaukee since 2012.
| Year | Total | Undergraduate | Graduate | ||||
|---|---|---|---|---|---|---|---|
| Total | Men | Women | Total | Men | Women | ||
| 2012-13 | 407 | 331 | 89 | 242 | 76 | 19 | 57 |
| 2013-14 | 341 -66 | 289 -42 | 69 -20 | 220 -22 | 52 -24 | 16 -3 | 36 -21 |
| 2014-15 | 289 -52 | 227 -62 | 51 -18 | 176 -44 | 62 10 | 15 -1 | 47 11 |
| 2015-16 | 208 -81 | 158 -69 | 41 -10 | 117 -59 | 50 -12 | 15 0 | 35 -12 |
| 2016-17 | 198 -10 | 160 2 | 36 -5 | 124 7 | 38 -12 | 9 -6 | 29 -6 |
| 2017-18 | 206 8 | 166 6 | 35 -1 | 131 7 | 40 2 | 9 0 | 31 2 |
| 2018-19 | 194 -12 | 153 -13 | 30 -5 | 123 -8 | 41 1 | 9 0 | 32 1 |
| 2019-20 | 236 42 | 132 -21 | 27 -3 | 105 -18 | 104 63 | 39 30 | 65 33 |
| 2020-21 | 237 1 | 105 -27 | 25 -2 | 80 -25 | 132 28 | 49 10 | 83 18 |
| 2021-22 | 172 -65 | 89 -16 | 19 -6 | 70 -10 | 83 -49 | 34 -15 | 49 -34 |
| 2022-23 | 124 -48 | 63 -26 | 7 -12 | 56 -14 | 61 -22 | 21 -13 | 40 -9 |
| Average | 237 | 170 | 39 | 131 | 67 | 21 | 46 |