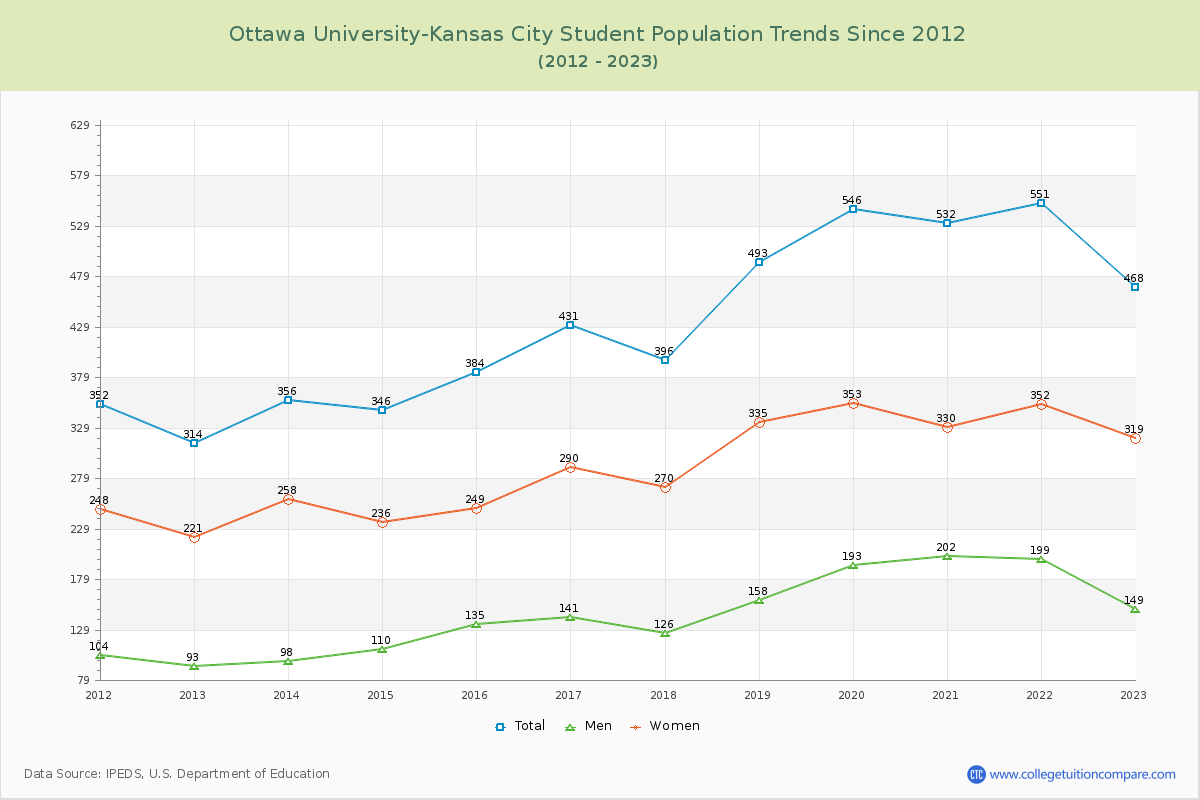
Student Population Changes
The average student population over the last 12 years is 438 where 468 students are attending the school for the academic year 2022-2023.
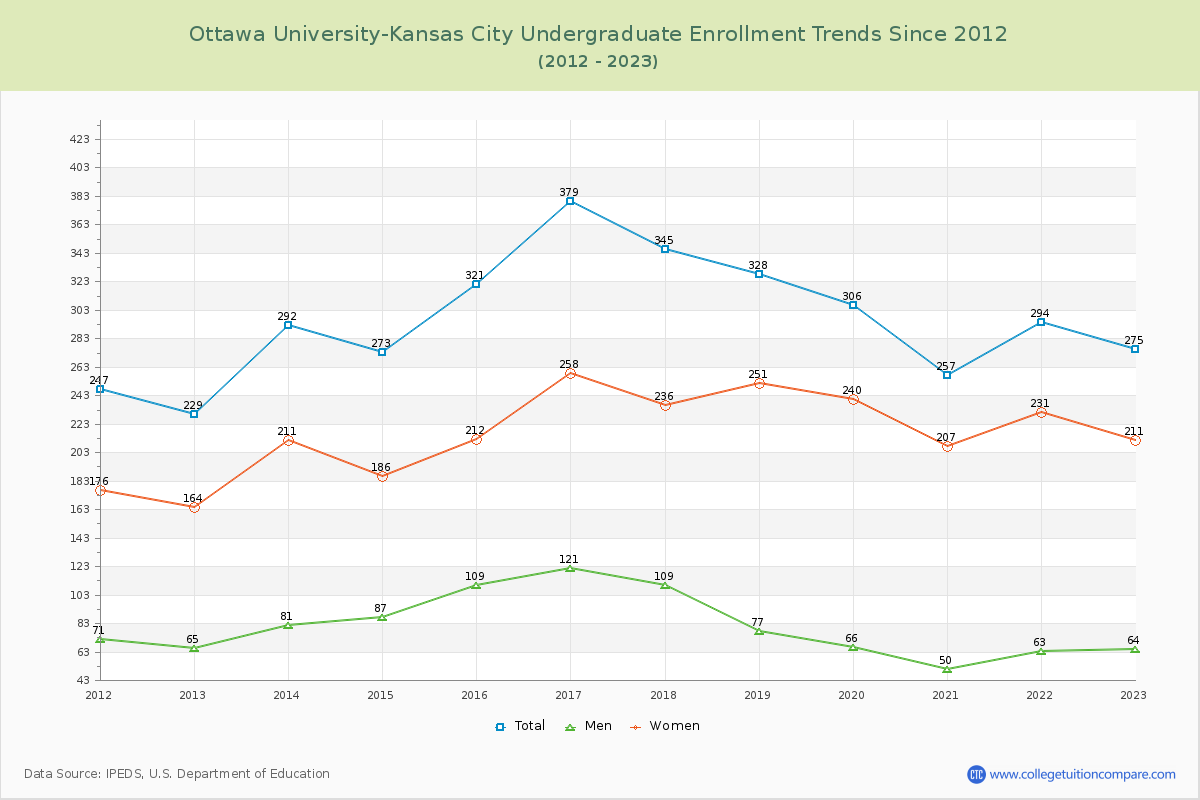
58.76% of total students is undergraduate students and 41.24% students is graduate students. The number of undergraduate students has increased by 46 and the graduate enrollment has increased by 108 over past 10 years.
The female to male ratio is 2.14 to 1 and it means that there are far more female students enrolled in OUKC than male students.
The following table and chart illustrate the changes in student population by gender at Ottawa University-Kansas City since 2012.
| Year | Total | Undergraduate | Graduate | ||||
|---|---|---|---|---|---|---|---|
| Total | Men | Women | Total | Men | Women | ||
| 2012-13 | 314 | 229 | 65 | 164 | 85 | 28 | 57 |
| 2013-14 | 356 42 | 292 63 | 81 16 | 211 47 | 64 -21 | 17 -11 | 47 -10 |
| 2014-15 | 346 -10 | 273 -19 | 87 6 | 186 -25 | 73 9 | 23 6 | 50 3 |
| 2015-16 | 384 38 | 321 48 | 109 22 | 212 26 | 63 -10 | 26 3 | 37 -13 |
| 2016-17 | 431 47 | 379 58 | 121 12 | 258 46 | 52 -11 | 20 -6 | 32 -5 |
| 2017-18 | 396 -35 | 345 -34 | 109 -12 | 236 -22 | 51 -1 | 17 -3 | 34 2 |
| 2018-19 | 493 97 | 328 -17 | 77 -32 | 251 15 | 165 114 | 81 64 | 84 50 |
| 2019-20 | 546 53 | 306 -22 | 66 -11 | 240 -11 | 240 75 | 127 46 | 113 29 |
| 2020-21 | 532 -14 | 257 -49 | 50 -16 | 207 -33 | 275 35 | 152 25 | 123 10 |
| 2021-22 | 551 19 | 294 37 | 63 13 | 231 24 | 257 -18 | 136 -16 | 121 -2 |
| 2022-23 | 468 -83 | 275 -19 | 64 1 | 211 -20 | 193 -64 | 85 -51 | 108 -13 |
| Average | 438 | 300 | 81 | 219 | 138 | 65 | 73 |