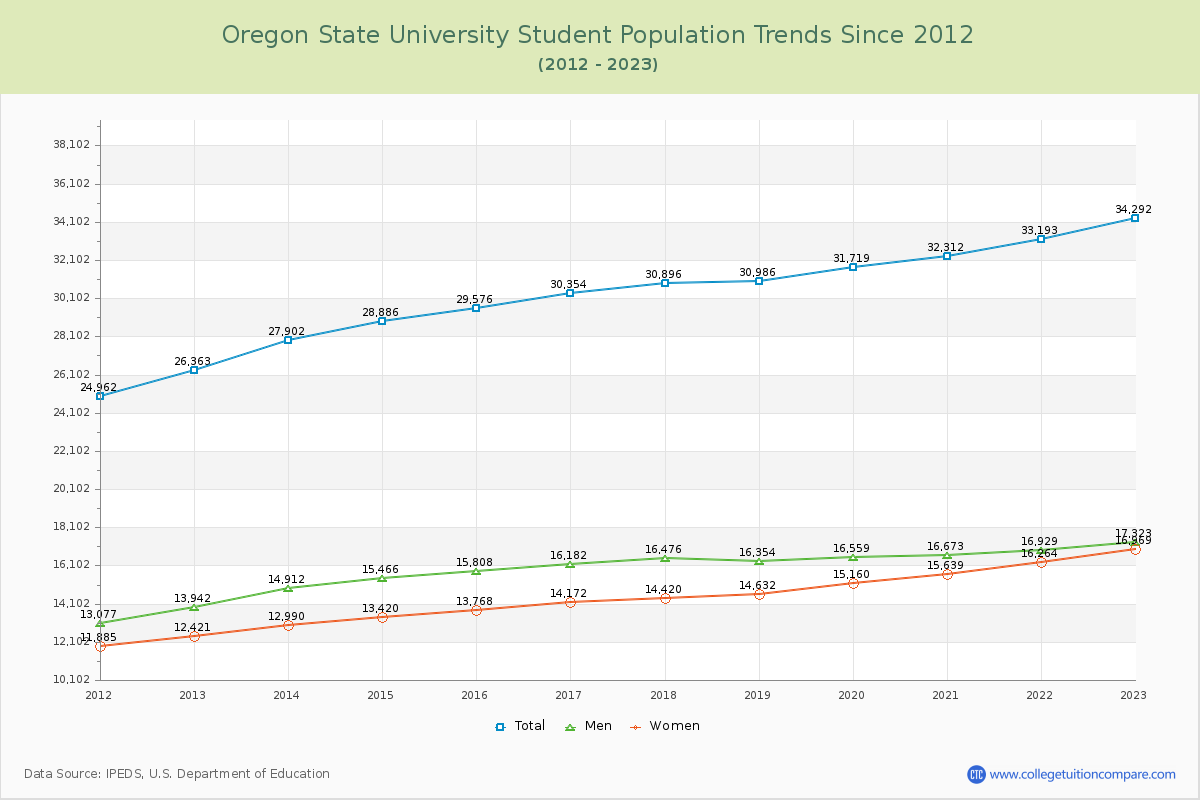
Student Population Changes
The average student population over the last 12 years is 30,589 where 34,292 students are attending the school for the academic year 2022-2023.
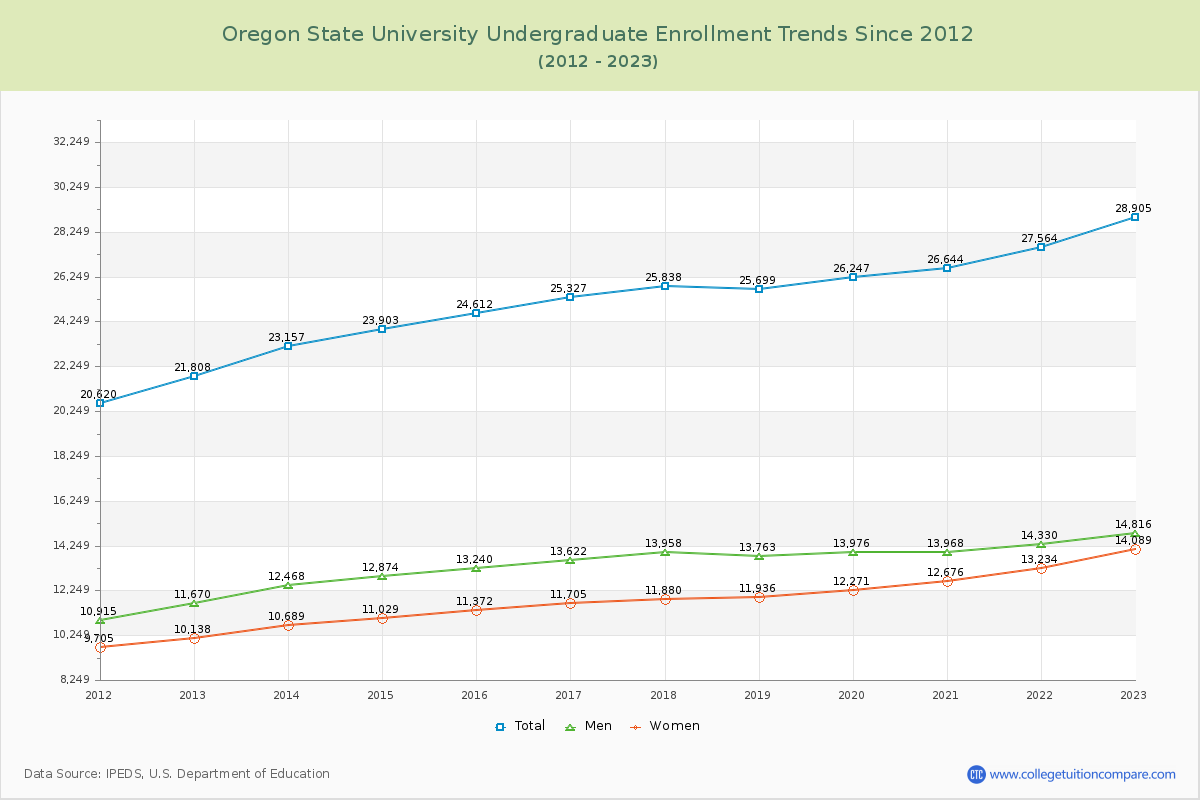
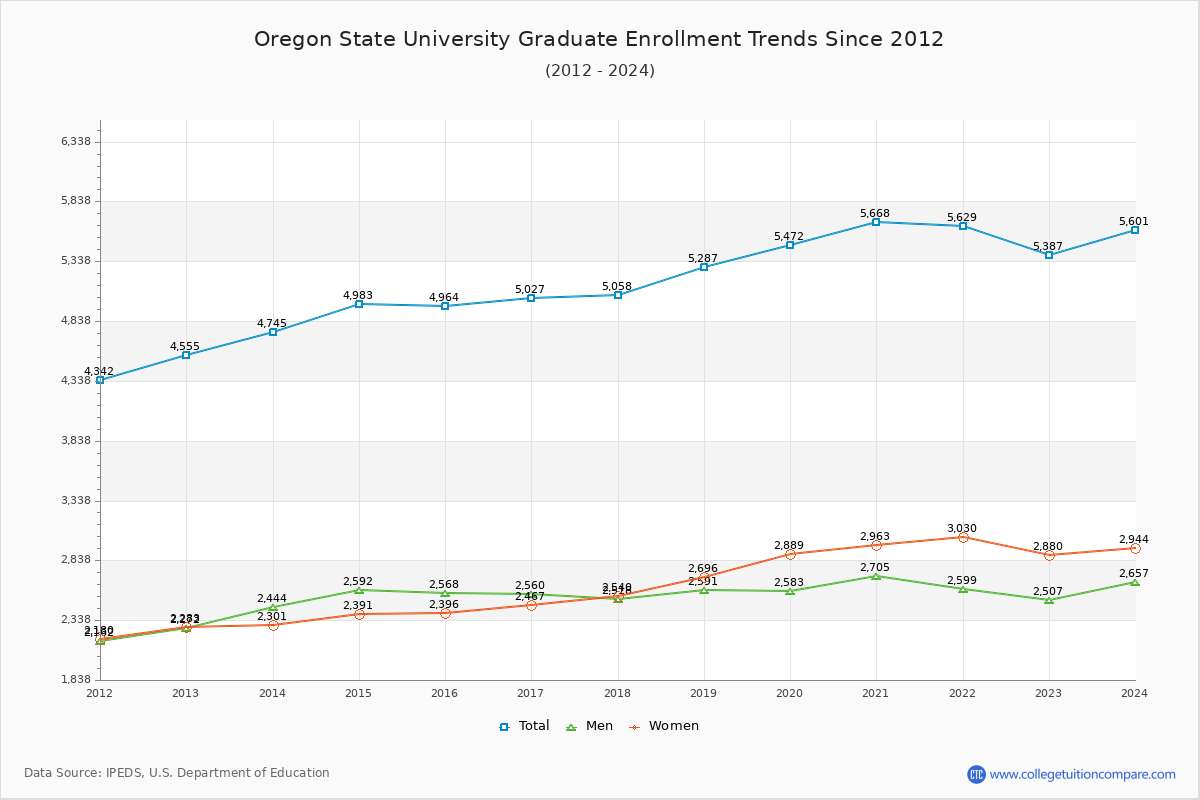
84.29% of total students is undergraduate students and 15.71% students is graduate students. The number of undergraduate students has increased by 7,097 and the graduate enrollment has increased by 832 over past 10 years.
The female to male ratio is 0.98 to 1 and it means that there are similar numbers of female and male students enrolled in Oregon State.
The following table and chart illustrate the changes in student population by gender at Oregon State University since 2012.
| Year | Total | Undergraduate | Graduate | ||||
|---|---|---|---|---|---|---|---|
| Total | Men | Women | Total | Men | Women | ||
| 2012-13 | 26,363 | 21,808 | 11,670 | 10,138 | 4,555 | 2,272 | 2,283 |
| 2013-14 | 27,902 1,539 | 23,157 1,349 | 12,468 798 | 10,689 551 | 4,745 190 | 2,444 172 | 2,301 18 |
| 2014-15 | 28,886 984 | 23,903 746 | 12,874 406 | 11,029 340 | 4,983 238 | 2,592 148 | 2,391 90 |
| 2015-16 | 29,576 690 | 24,612 709 | 13,240 366 | 11,372 343 | 4,964 -19 | 2,568 -24 | 2,396 5 |
| 2016-17 | 30,354 778 | 25,327 715 | 13,622 382 | 11,705 333 | 5,027 63 | 2,560 -8 | 2,467 71 |
| 2017-18 | 30,896 542 | 25,838 511 | 13,958 336 | 11,880 175 | 5,058 31 | 2,518 -42 | 2,540 73 |
| 2018-19 | 30,986 90 | 25,699 -139 | 13,763 -195 | 11,936 56 | 5,287 229 | 2,591 73 | 2,696 156 |
| 2019-20 | 31,719 733 | 26,247 548 | 13,976 213 | 12,271 335 | 5,472 185 | 2,583 -8 | 2,889 193 |
| 2020-21 | 32,312 593 | 26,644 397 | 13,968 -8 | 12,676 405 | 5,668 196 | 2,705 122 | 2,963 74 |
| 2021-22 | 33,193 881 | 27,564 920 | 14,330 362 | 13,234 558 | 5,629 -39 | 2,599 -106 | 3,030 67 |
| 2022-23 | 34,292 1,099 | 28,905 1,341 | 14,816 486 | 14,089 855 | 5,387 -242 | 2,507 -92 | 2,880 -150 |
| Average | 30,589 | 25,428 | 13,517 | 11,911 | 5,161 | 2,540 | 2,621 |