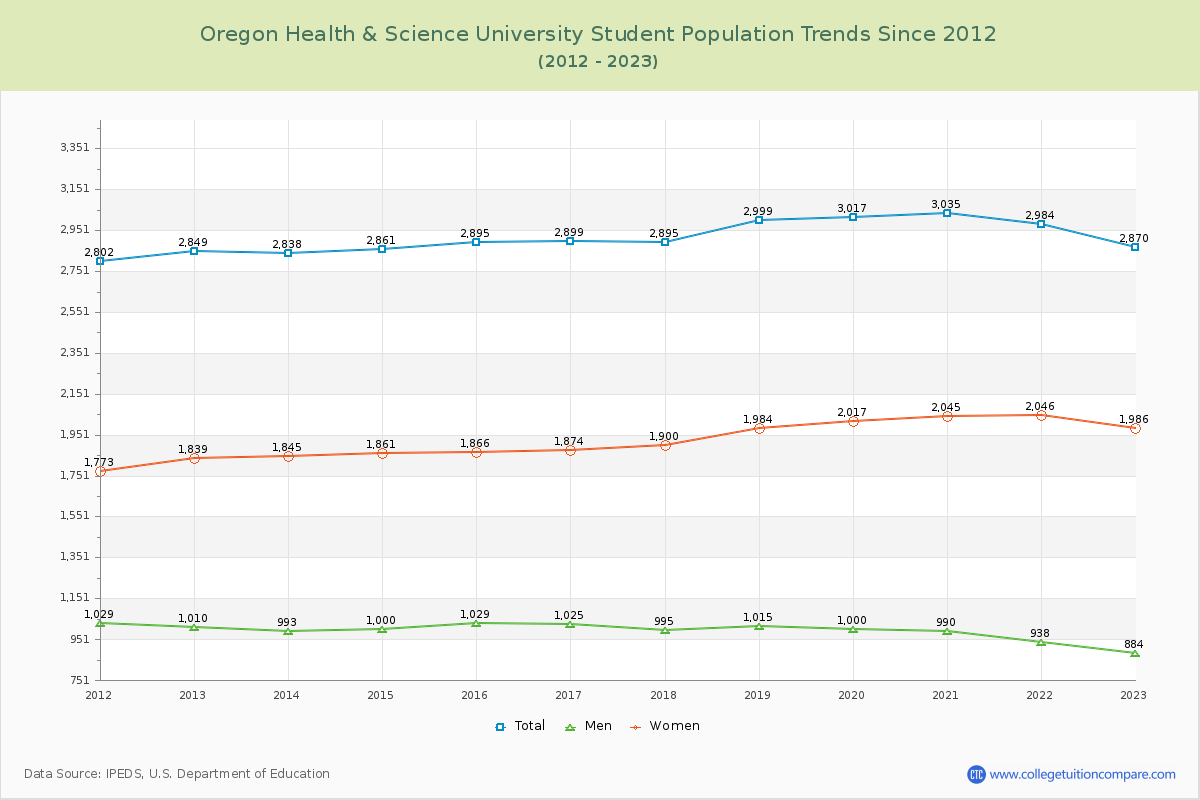
Student Population Changes
The average student population over the last 12 years is 2,922 where 2,870 students are attending the school for the academic year 2022-2023.
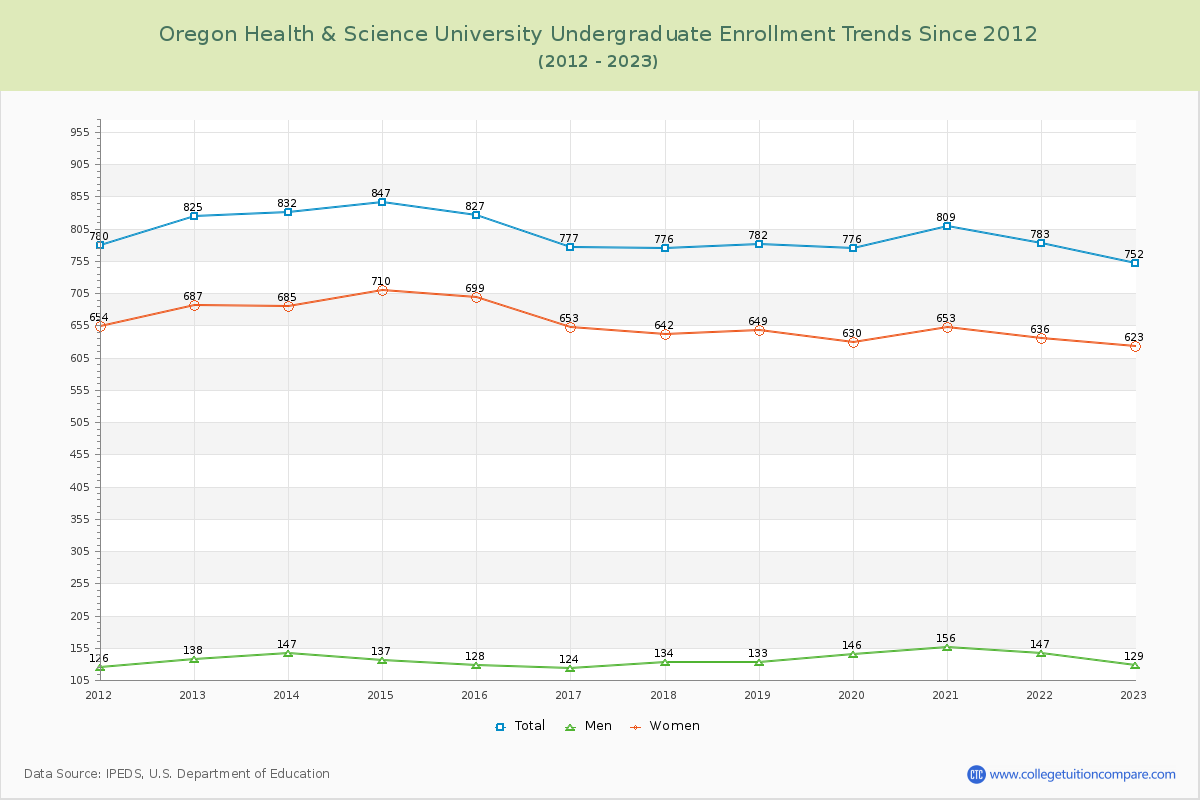
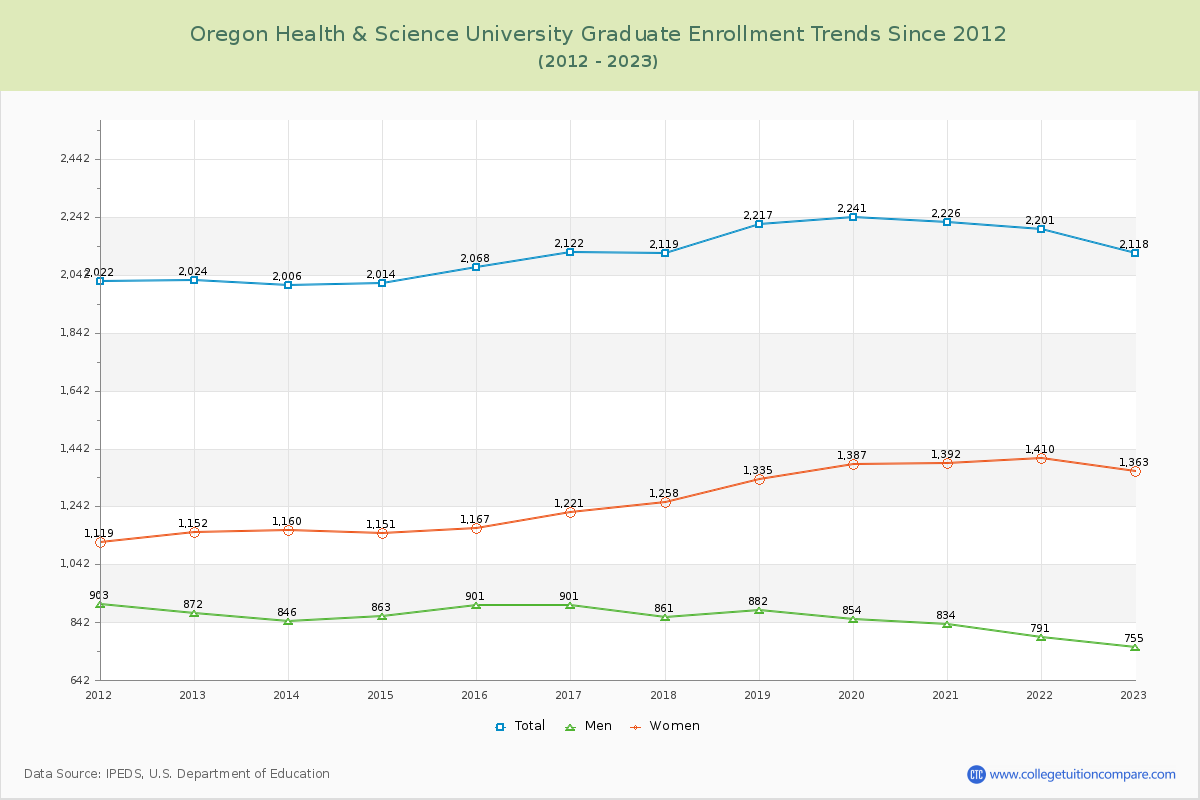
26.20% of total students is undergraduate students and 73.80% students is graduate students. The number of undergraduate students has decreased by 73 and the graduate enrollment has increased by 94 over past 10 years.
The female to male ratio is 2.25 to 1 and it means that there are far more female students enrolled in OHSU than male students.
The following table and chart illustrate the changes in student population by gender at Oregon Health & Science University since 2012.
| Year | Total | Undergraduate | Graduate | ||||
|---|---|---|---|---|---|---|---|
| Total | Men | Women | Total | Men | Women | ||
| 2012-13 | 2,849 | 825 | 138 | 687 | 2,024 | 872 | 1,152 |
| 2013-14 | 2,838 -11 | 832 7 | 147 9 | 685 -2 | 2,006 -18 | 846 -26 | 1,160 8 |
| 2014-15 | 2,861 23 | 847 15 | 137 -10 | 710 25 | 2,014 8 | 863 17 | 1,151 -9 |
| 2015-16 | 2,895 34 | 827 -20 | 128 -9 | 699 -11 | 2,068 54 | 901 38 | 1,167 16 |
| 2016-17 | 2,899 4 | 777 -50 | 124 -4 | 653 -46 | 2,122 54 | 901 0 | 1,221 54 |
| 2017-18 | 2,895 -4 | 776 -1 | 134 10 | 642 -11 | 2,119 -3 | 861 -40 | 1,258 37 |
| 2018-19 | 2,999 104 | 782 6 | 133 -1 | 649 7 | 2,217 98 | 882 21 | 1,335 77 |
| 2019-20 | 3,017 18 | 776 -6 | 146 13 | 630 -19 | 2,241 24 | 854 -28 | 1,387 52 |
| 2020-21 | 3,035 18 | 809 33 | 156 10 | 653 23 | 2,226 -15 | 834 -20 | 1,392 5 |
| 2021-22 | 2,984 -51 | 783 -26 | 147 -9 | 636 -17 | 2,201 -25 | 791 -43 | 1,410 18 |
| 2022-23 | 2,870 -114 | 752 -31 | 129 -18 | 623 -13 | 2,118 -83 | 755 -36 | 1,363 -47 |
| Average | 2,922 | 799 | 138 | 661 | 2,123 | 851 | 1,272 |