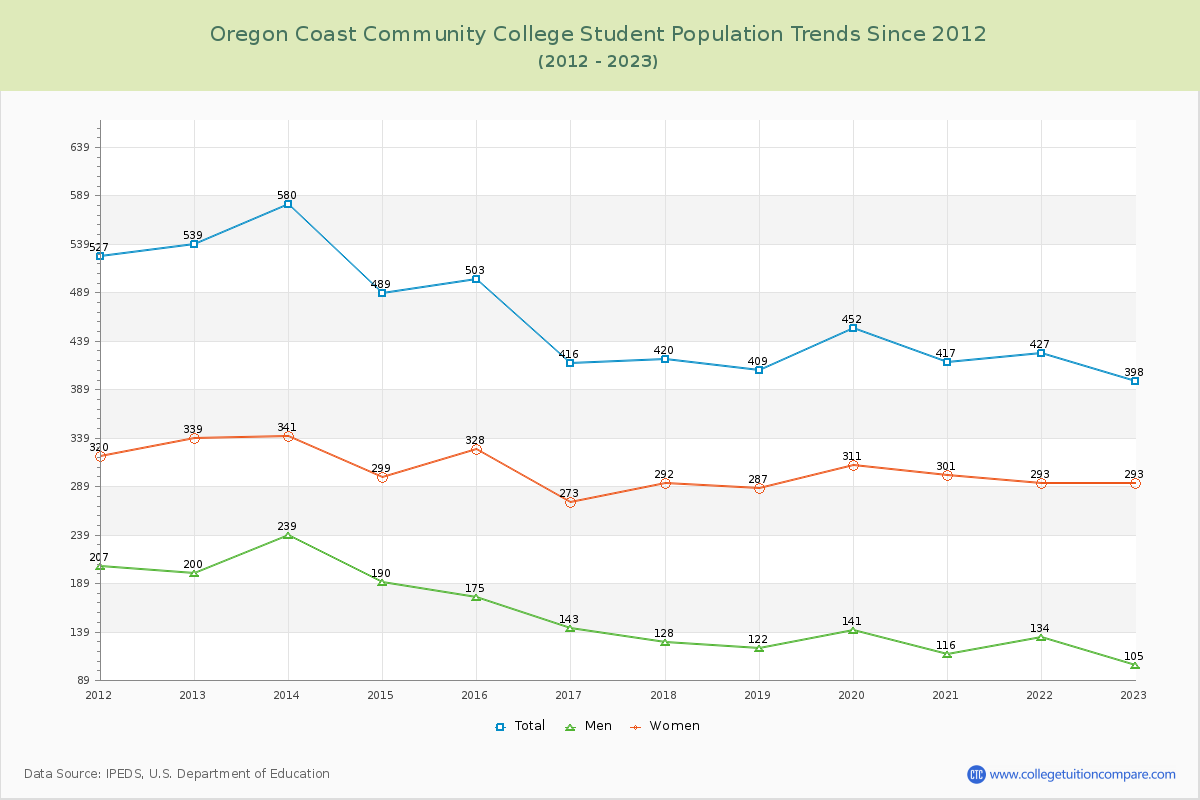
Student Population Changes
The average student population over the last 12 years is 459 where 398 students are attending the school for the academic year 2022-2023.
The female to male ratio is 2.79 to 1 and it means that there are far more female students enrolled in Oregon Coast CC than male students.
The following table and chart illustrate the changes in student population by gender at Oregon Coast Community College since 2012.
| Year | Total | Men | Women |
|---|---|---|---|
| 2012-13 | 539 | 200 | 339 |
| 2013-14 | 580 41 | 239 39 | 341 2 |
| 2014-15 | 489 -91 | 190 -49 | 299 -42 |
| 2015-16 | 503 14 | 175 -15 | 328 29 |
| 2016-17 | 416 -87 | 143 -32 | 273 -55 |
| 2017-18 | 420 4 | 128 -15 | 292 19 |
| 2018-19 | 409 -11 | 122 -6 | 287 -5 |
| 2019-20 | 452 43 | 141 19 | 311 24 |
| 2020-21 | 417 -35 | 116 -25 | 301 -10 |
| 2021-22 | 427 10 | 134 18 | 293 -8 |
| 2022-23 | 398 -29 | 105 -29 | 293 0 |
| Average | 459 | 154 | 305 |