Enrollment Trends at OCtech

-668

Total Enrollment

-382

Men

-286

Women

The student population at Orangeburg Calhoun Technical College is 2,106 (all undergraduate). The number of students has decreased by 668 over the past decade.

The female to male ratio is 2.40 to 1 which means that majority of population is on female students.

1,189 students enrolled in online degree program exclusively and the number of online students has increased by 438.01% since 2015.

Student Population Changes

The average student population over the last 11 years is 2,324 where 2,106 students are attending the school for the academic year 2024-2025.

The female to male ratio is 2.40 to 1 and it means that there are far more female students enrolled in OCtech than male students.

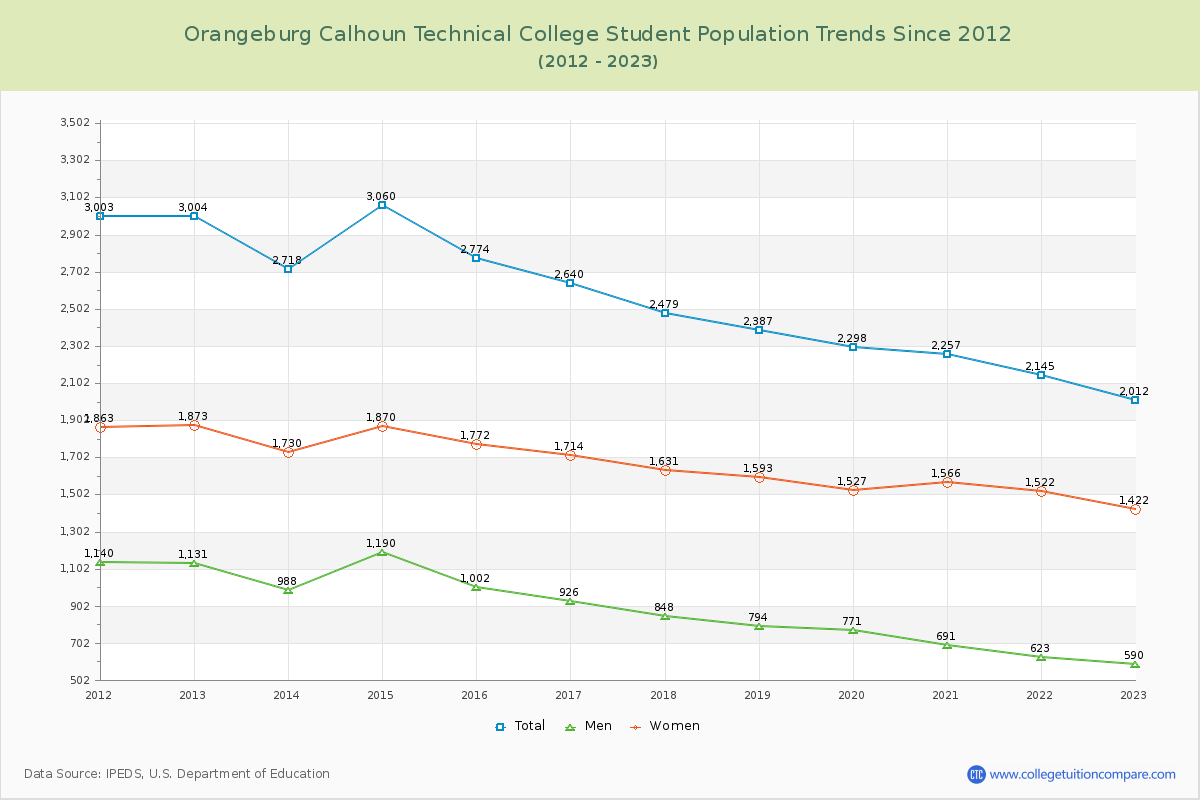
The following table and chart illustrate the changes in student population by gender at Orangeburg Calhoun Technical College since 2015.

YearTotalMenWomen
2015-162,7741,0021,772
2016-172,640
-134
926
-76
1,714
-58
2017-182,479
-161
848
-78
1,631
-83
2018-192,387
-92
794
-54
1,593
-38
2019-202,298
-89
771
-23
1,527
-66
2020-212,257
-41
691
-80
1,566
39
2021-222,145
-112
623
-68
1,522
-44
2022-232,012
-133
590
-33
1,422
-100
2023-242,146
134
648
58
1,498
76
2024-252,106
-40
620
-28
1,486
-12
Average2,3247511,573
Orangeburg Calhoun Technical College Enrollment Trends Chart

Enrollment by Race/Ethnicity Changes

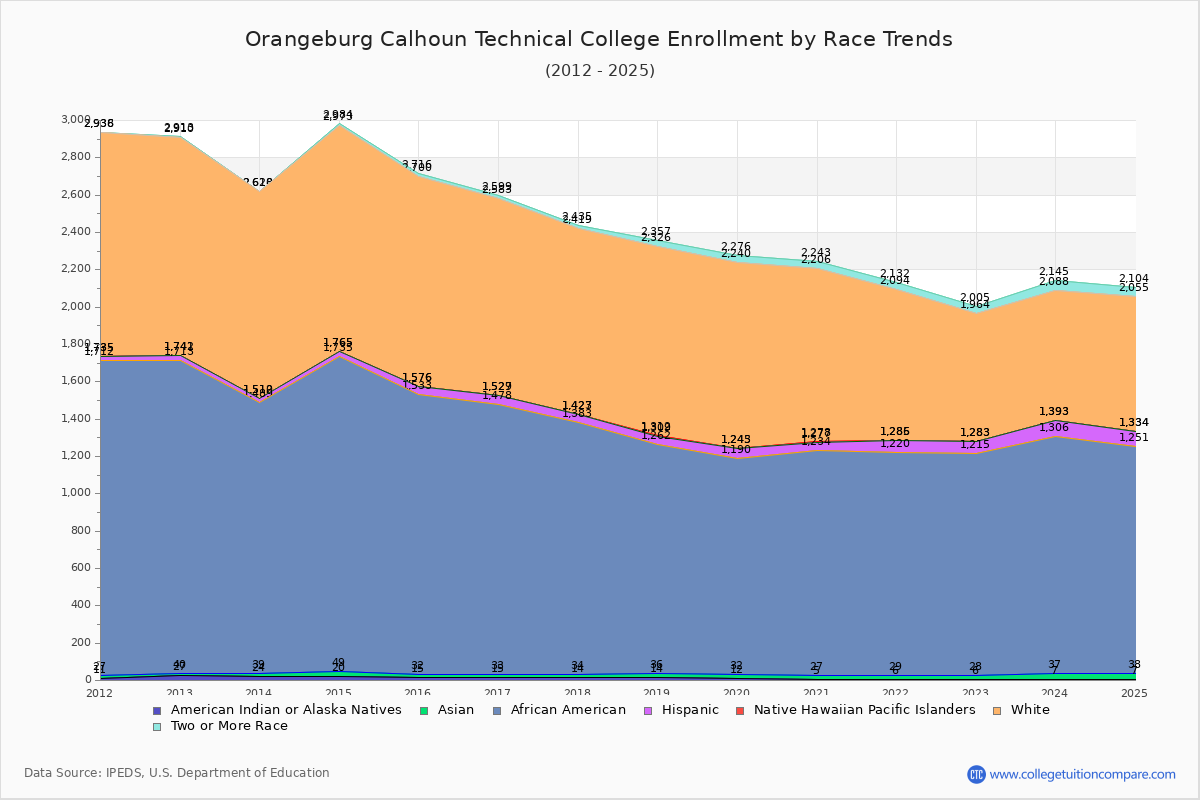
The percentage of white students is 34.24% and the percentage of black students is 57.60% at Orangeburg Calhoun Technical College. 1.47% of enrolled students is Asian. Hispanic students comprise 3.94% of the student body.

Over the past 10 years, the racial composition has shifted. The percentage of white students decreased from 40.52% to 34.24%. Asian enrollment grew from 0.61% to 1.47%. Black student enrollment increased from 54.11% to 57.60%. Hispanic student representation expanded from 1.55% to 3.94%.

The overall racial diversity, measured by the Census Bureau Diversity Index, is 0.5487 which indicates that somewhat diverse. This increased from 0.5427 a decade ago, suggesting that racial diversity has improved.

The following table and chart illustrate the student population trends by race/ethnicity at Orangeburg Calhoun Technical College over the past 11 years (2015-2025).

YearAmerican Indian or Native AmericanAsianBlackHispanicNative Hawaiian or Other Pacific IslanderWhiteTwo or More Races
2015-1615171,5014301,12416
2016-1715181,4454921,05416
2017-1814201,34940499216
2018-1914221,2264731,01431
2019-2012201,15853299536
2020-215221,20743192837
2021-226231,19165180838
2022-236221,18768068141
2023-247301,26987069557
2024-257311,21383072149
Average10231,27558190134
Orangeburg Calhoun Technical College Enrollment by Race Trends Chart

Distance Learning (Online Courses) Enrollment Changes

1,189 students are enrolled in online degree programs exclusively for the academic year 2024-2025, which is 57% of total students. The number of online students has increased 438.01% since 2015. The following table and chart illustrate the changes in the online student population by enrolled type at Orangeburg Calhoun Technical College from 2015 to 2025.

YearTotal EnrollmentOnline CompletelyEnrolled in Some Online CoursesNot Enrolled in Online Courses
2015-162,7742215701,983
2016-172,6402516151,774
2017-182,4792165991,664
2018-192,3872477041,436
2019-202,2982887141,296
2020-212,2571,127766364
2021-222,145892907346
2022-232,012728868416
2023-242,1461,261713172
2024-252,1061,189631286
Average2,324642709974

Ratings & Review

Share your experiences and thoughts about Orangeburg Calhoun Technical College. It will be a great help to applicants and prospective students!