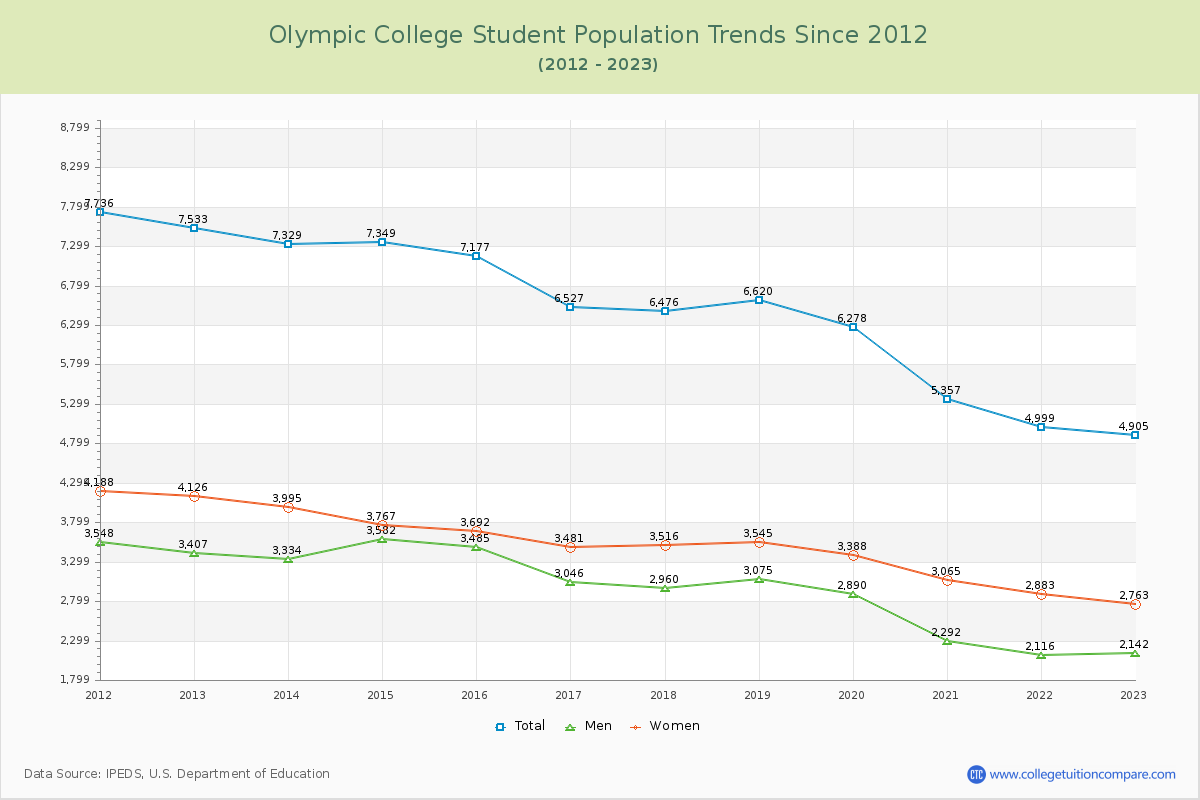
Student Population Changes
The average student population over the last 12 years is 6,414 where 4,905 students are attending the school for the academic year 2022-2023.
The female to male ratio is 1.29 to 1 and it means that there are slightly more female students enrolled in OC than male students.
The following table and chart illustrate the changes in student population by gender at Olympic College since 2012.
| Year | Total | Men | Women |
|---|---|---|---|
| 2012-13 | 7,533 | 3,407 | 4,126 |
| 2013-14 | 7,329 -204 | 3,334 -73 | 3,995 -131 |
| 2014-15 | 7,349 20 | 3,582 248 | 3,767 -228 |
| 2015-16 | 7,177 -172 | 3,485 -97 | 3,692 -75 |
| 2016-17 | 6,527 -650 | 3,046 -439 | 3,481 -211 |
| 2017-18 | 6,476 -51 | 2,960 -86 | 3,516 35 |
| 2018-19 | 6,620 144 | 3,075 115 | 3,545 29 |
| 2019-20 | 6,278 -342 | 2,890 -185 | 3,388 -157 |
| 2020-21 | 5,357 -921 | 2,292 -598 | 3,065 -323 |
| 2021-22 | 4,999 -358 | 2,116 -176 | 2,883 -182 |
| 2022-23 | 4,905 -94 | 2,142 26 | 2,763 -120 |
| Average | 6,414 | 2,939 | 3,475 |