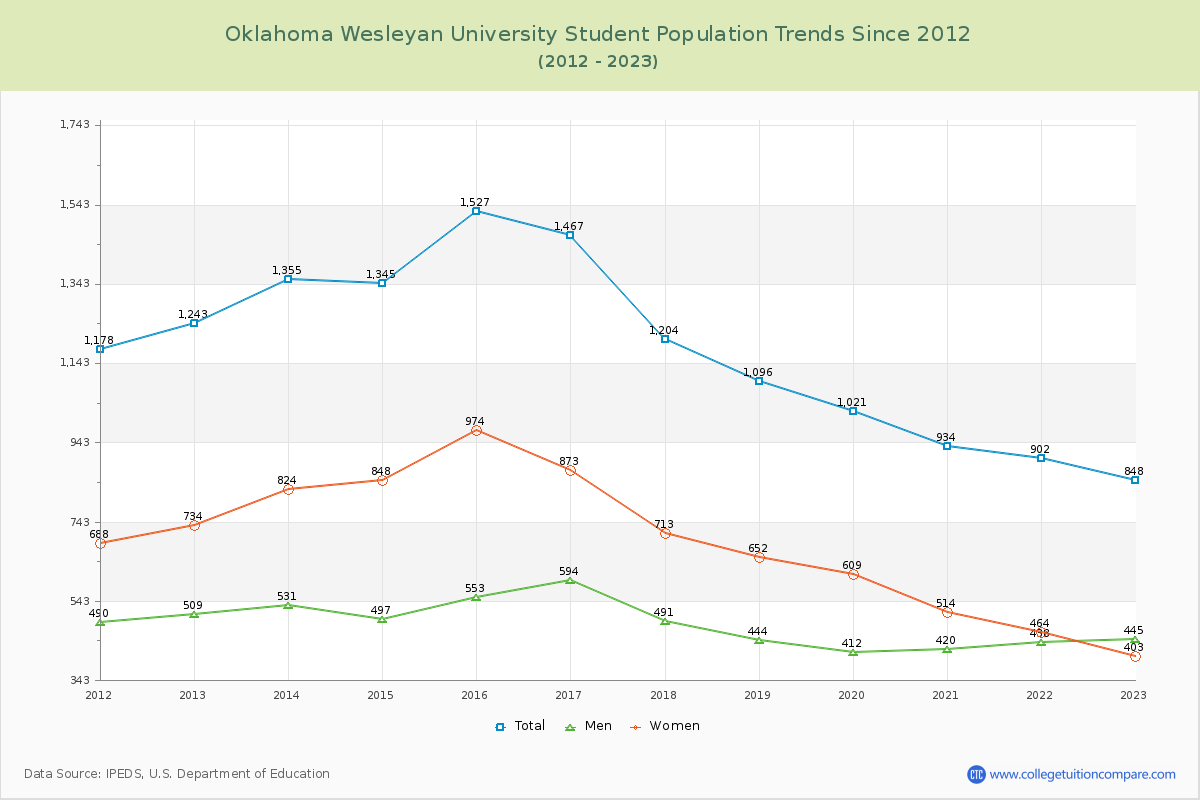
Student Population Changes
The average student population over the last 12 years is 1,177 where 848 students are attending the school for the academic year 2022-2023.
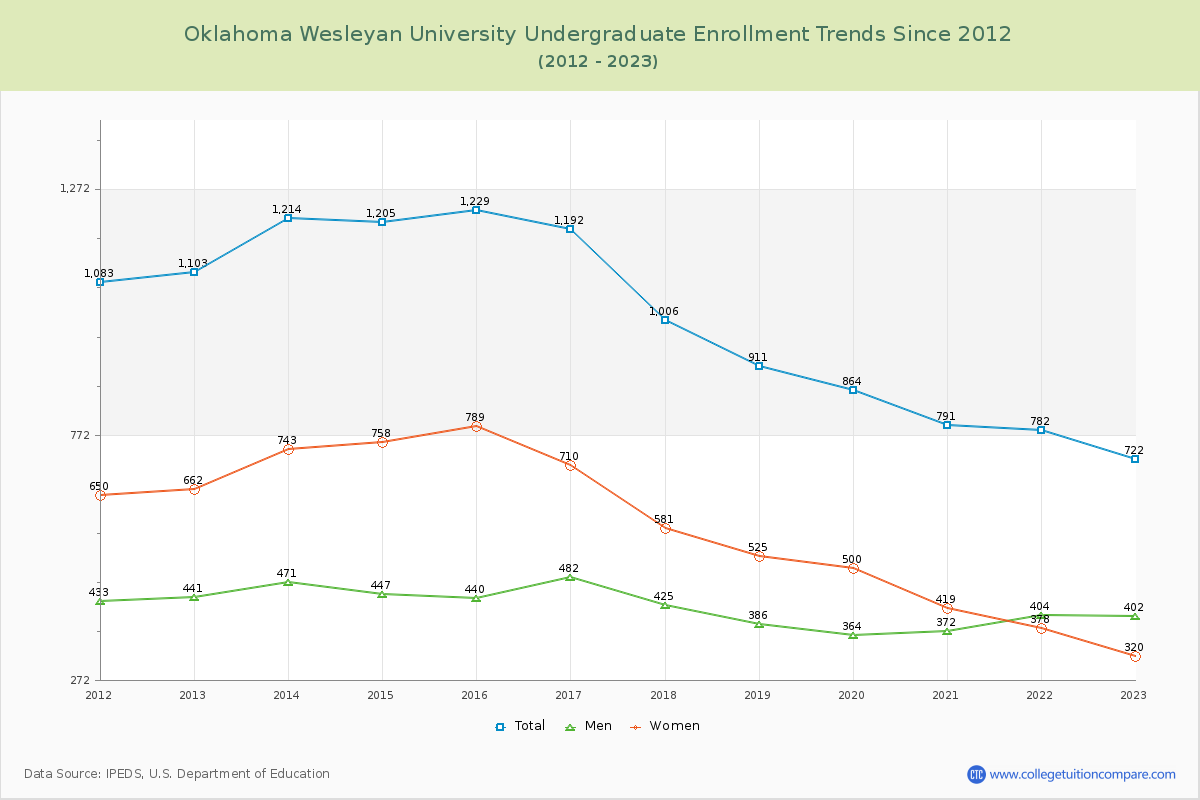
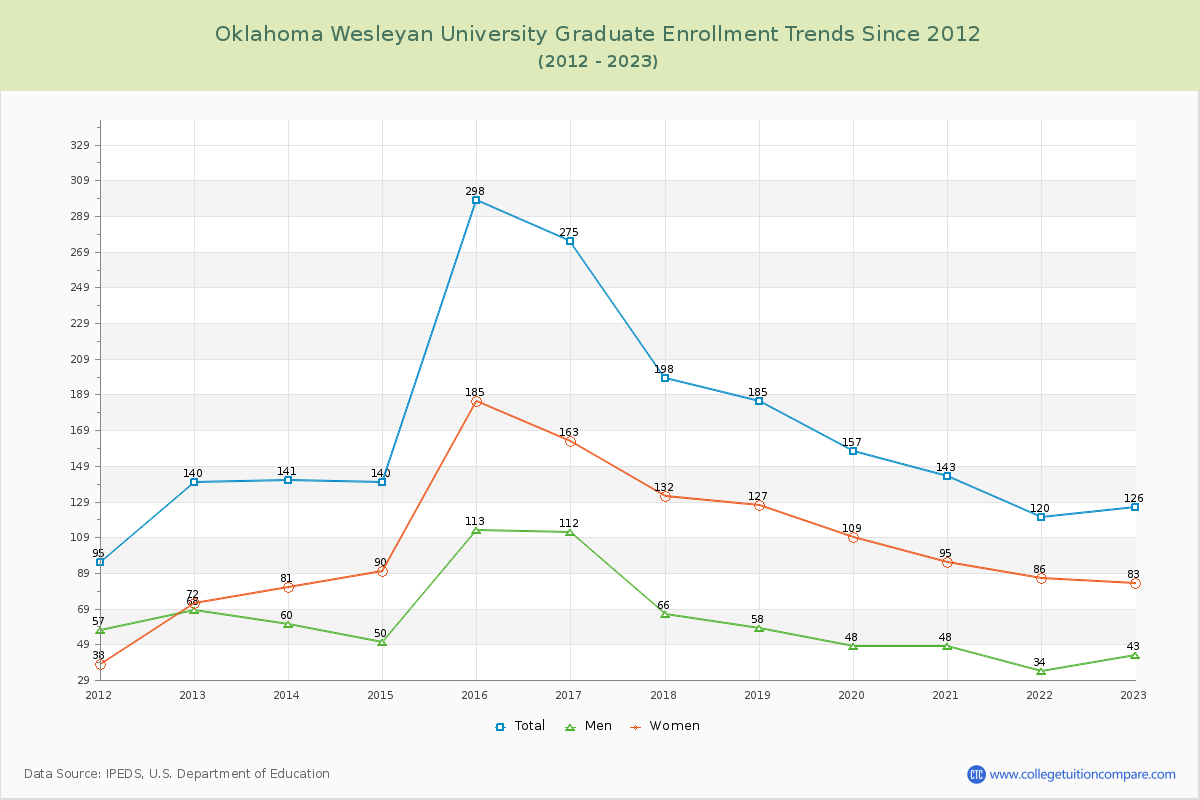
85.14% of total students is undergraduate students and 14.86% students is graduate students. The number of undergraduate students has decreased by 381 and the graduate enrollment has decreased by 14 over past 10 years.
The female to male ratio is 0.91 to 1 and it means that there are similar numbers of female and male students enrolled in OKWU.
The following table and chart illustrate the changes in student population by gender at Oklahoma Wesleyan University since 2012.
| Year | Total | Undergraduate | Graduate | ||||
|---|---|---|---|---|---|---|---|
| Total | Men | Women | Total | Men | Women | ||
| 2012-13 | 1,243 | 1,103 | 441 | 662 | 140 | 68 | 72 |
| 2013-14 | 1,355 112 | 1,214 111 | 471 30 | 743 81 | 141 1 | 60 -8 | 81 9 |
| 2014-15 | 1,345 -10 | 1,205 -9 | 447 -24 | 758 15 | 140 -1 | 50 -10 | 90 9 |
| 2015-16 | 1,527 182 | 1,229 24 | 440 -7 | 789 31 | 298 158 | 113 63 | 185 95 |
| 2016-17 | 1,467 -60 | 1,192 -37 | 482 42 | 710 -79 | 275 -23 | 112 -1 | 163 -22 |
| 2017-18 | 1,204 -263 | 1,006 -186 | 425 -57 | 581 -129 | 198 -77 | 66 -46 | 132 -31 |
| 2018-19 | 1,096 -108 | 911 -95 | 386 -39 | 525 -56 | 185 -13 | 58 -8 | 127 -5 |
| 2019-20 | 1,021 -75 | 864 -47 | 364 -22 | 500 -25 | 157 -28 | 48 -10 | 109 -18 |
| 2020-21 | 934 -87 | 791 -73 | 372 8 | 419 -81 | 143 -14 | 48 0 | 95 -14 |
| 2021-22 | 902 -32 | 782 -9 | 404 32 | 378 -41 | 120 -23 | 34 -14 | 86 -9 |
| 2022-23 | 848 -54 | 722 -60 | 402 -2 | 320 -58 | 126 6 | 43 9 | 83 -3 |
| Average | 1,177 | 1,002 | 421 | 580 | 175 | 64 | 111 |