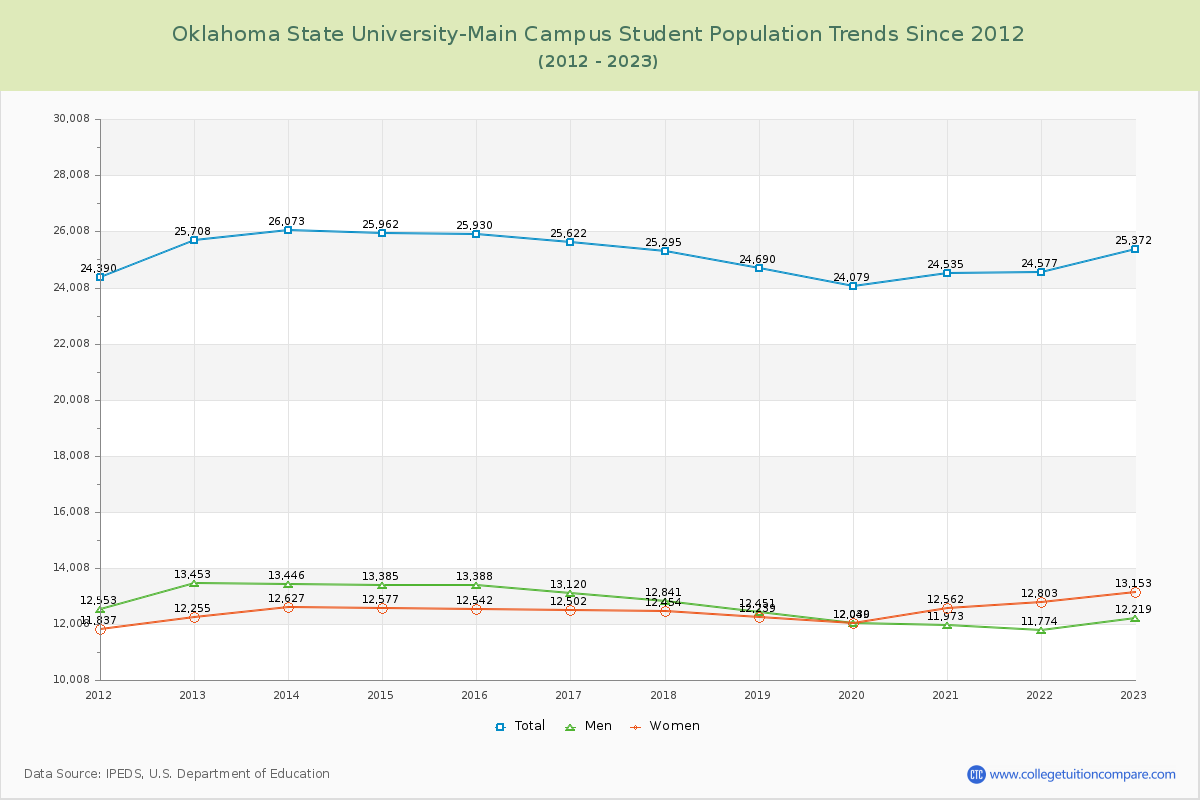
Student Population Changes
The average student population over the last 12 years is 25,258 where 25,372 students are attending the school for the academic year 2022-2023.
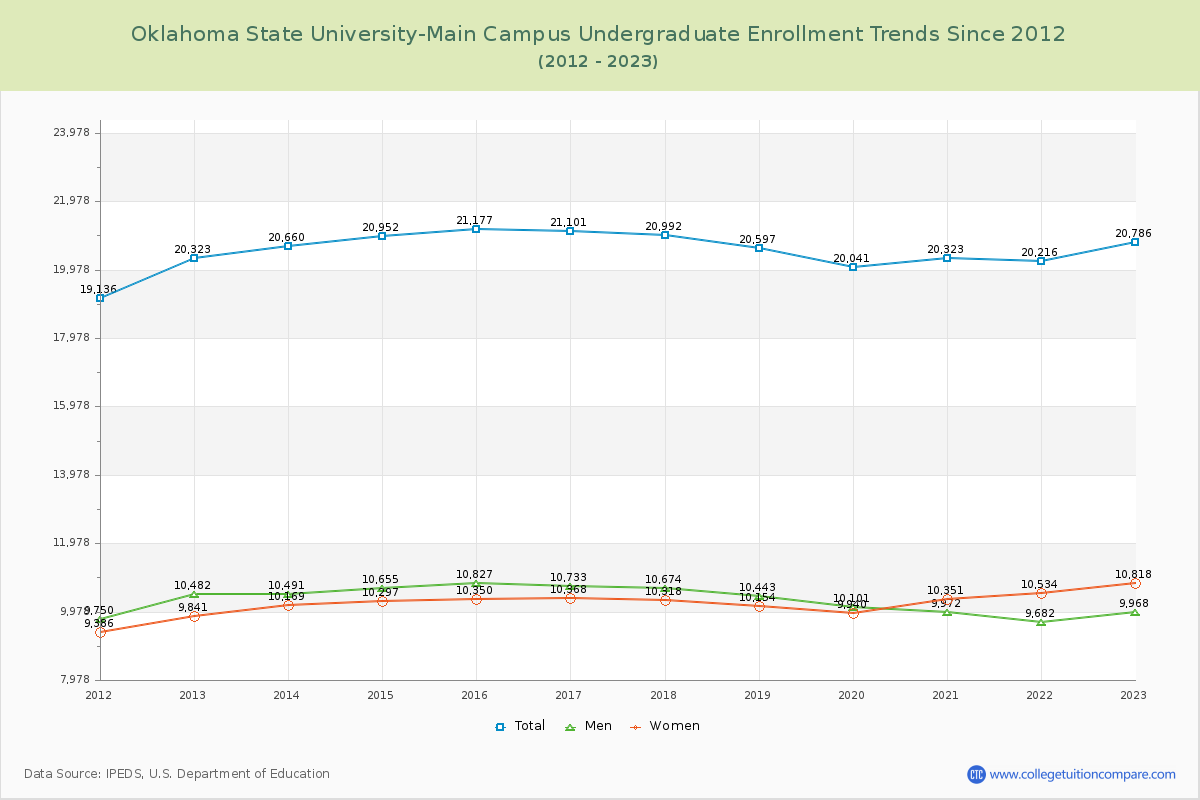
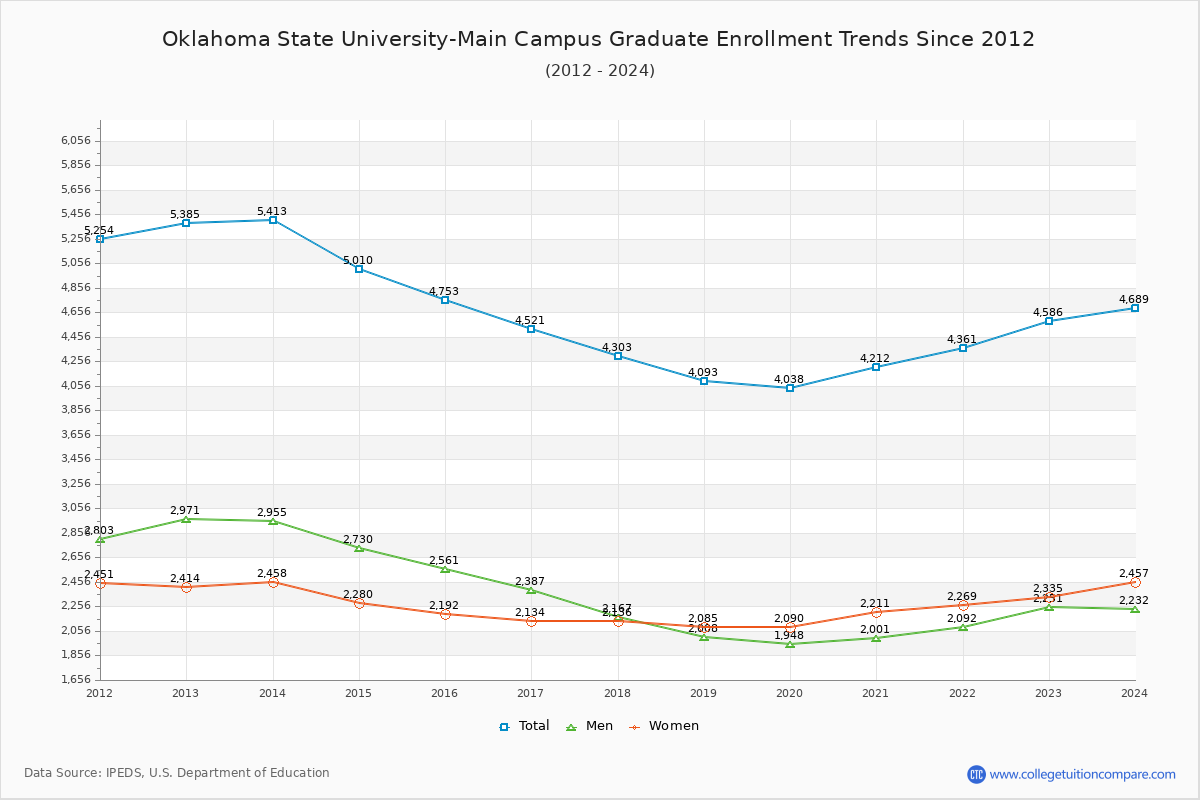
81.92% of total students is undergraduate students and 18.08% students is graduate students. The number of undergraduate students has increased by 463 and the graduate enrollment has decreased by 799 over past 10 years.
The female to male ratio is 1.08 to 1 and it means that there are similar numbers of female and male students enrolled in Oklahoma State.
The following table and chart illustrate the changes in student population by gender at Oklahoma State University-Main Campus since 2012.
| Year | Total | Undergraduate | Graduate | ||||
|---|---|---|---|---|---|---|---|
| Total | Men | Women | Total | Men | Women | ||
| 2012-13 | 25,708 | 20,323 | 10,482 | 9,841 | 5,385 | 2,971 | 2,414 |
| 2013-14 | 26,073 365 | 20,660 337 | 10,491 9 | 10,169 328 | 5,413 28 | 2,955 -16 | 2,458 44 |
| 2014-15 | 25,962 -111 | 20,952 292 | 10,655 164 | 10,297 128 | 5,010 -403 | 2,730 -225 | 2,280 -178 |
| 2015-16 | 25,930 -32 | 21,177 225 | 10,827 172 | 10,350 53 | 4,753 -257 | 2,561 -169 | 2,192 -88 |
| 2016-17 | 25,622 -308 | 21,101 -76 | 10,733 -94 | 10,368 18 | 4,521 -232 | 2,387 -174 | 2,134 -58 |
| 2017-18 | 25,295 -327 | 20,992 -109 | 10,674 -59 | 10,318 -50 | 4,303 -218 | 2,167 -220 | 2,136 2 |
| 2018-19 | 24,690 -605 | 20,597 -395 | 10,443 -231 | 10,154 -164 | 4,093 -210 | 2,008 -159 | 2,085 -51 |
| 2019-20 | 24,079 -611 | 20,041 -556 | 10,101 -342 | 9,940 -214 | 4,038 -55 | 1,948 -60 | 2,090 5 |
| 2020-21 | 24,535 456 | 20,323 282 | 9,972 -129 | 10,351 411 | 4,212 174 | 2,001 53 | 2,211 121 |
| 2021-22 | 24,577 42 | 20,216 -107 | 9,682 -290 | 10,534 183 | 4,361 149 | 2,092 91 | 2,269 58 |
| 2022-23 | 25,372 795 | 20,786 570 | 9,968 286 | 10,818 284 | 4,586 225 | 2,251 159 | 2,335 66 |
| Average | 25,258 | 20,652 | 10,366 | 10,285 | 4,607 | 2,370 | 2,237 |