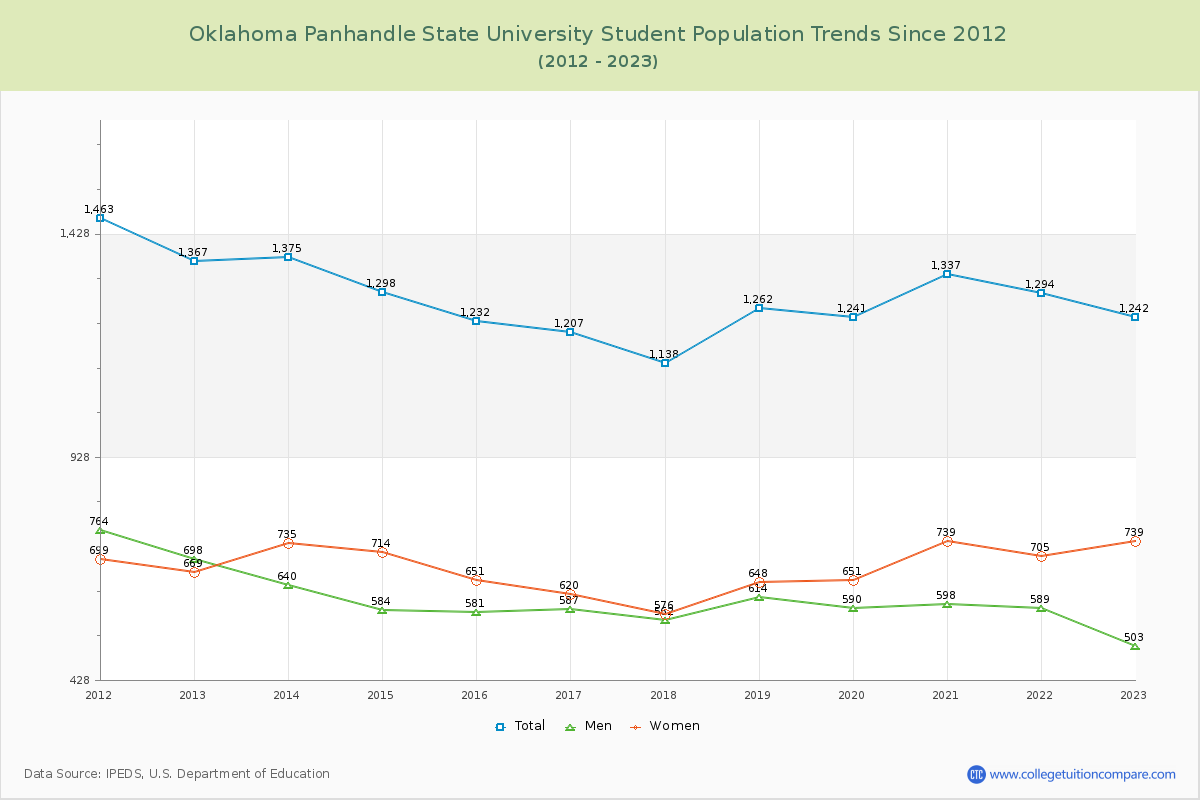
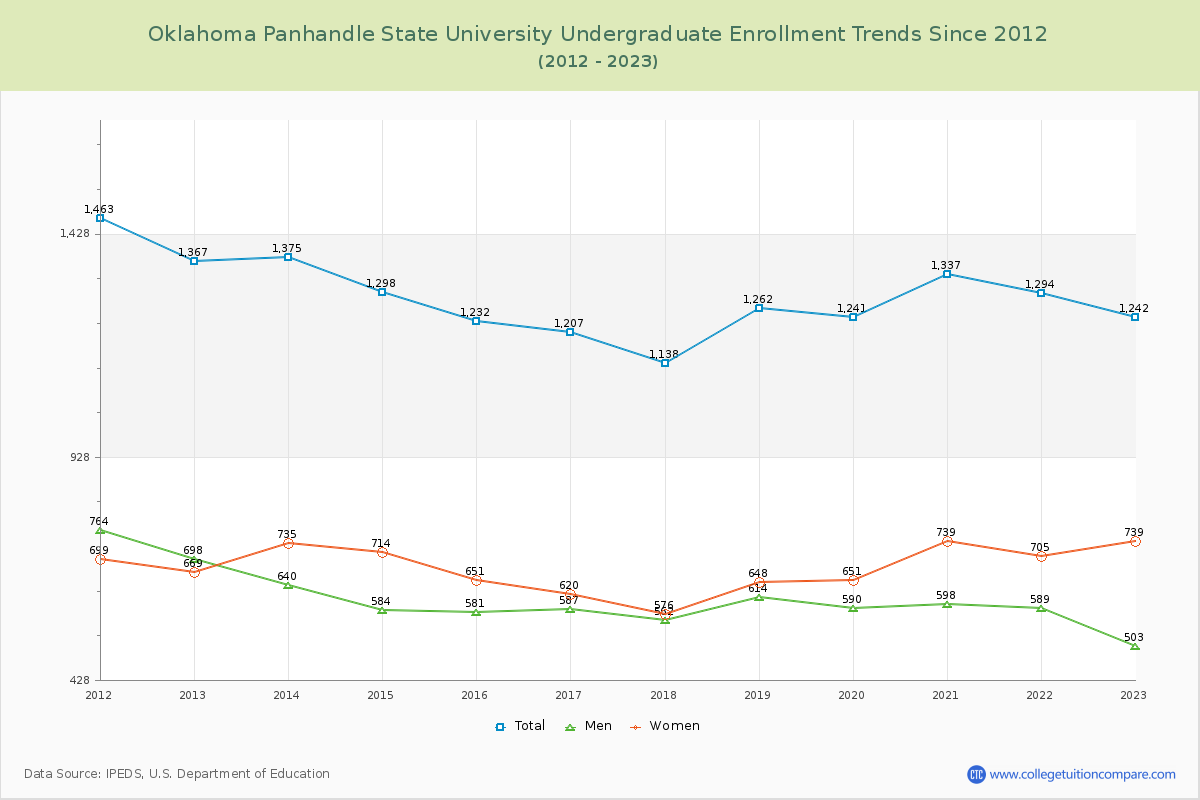
Student Population Changes
The average student population over the last 12 years is 1,272 where 1,242 students are attending the school for the academic year 2022-2023.
The female to male ratio is 1.47 to 1 and it means that there are more female students enrolled in OPSU than male students.
The following table and chart illustrate the changes in student population by gender at Oklahoma Panhandle State University since 2012.
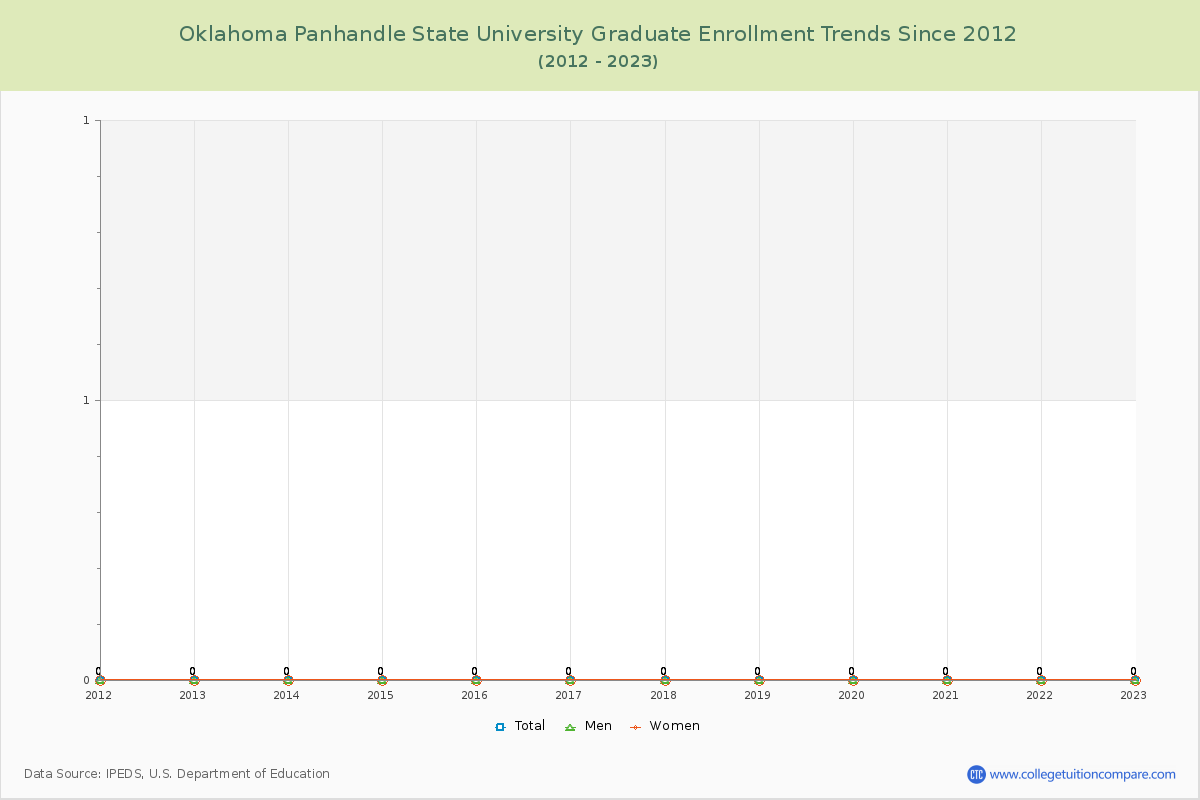
| Year | Total | Undergraduate | Graduate | ||||
|---|---|---|---|---|---|---|---|
| Total | Men | Women | Total | Men | Women | ||
| 2012-13 | 1,367 | 1,367 | 698 | 669 | 0 | 0 | 0 |
| 2013-14 | 1,375 8 | 1,375 8 | 640 -58 | 735 66 | 0 0 | 0 0 | 0 0 |
| 2014-15 | 1,298 -77 | 1,298 -77 | 584 -56 | 714 -21 | 0 0 | 0 0 | 0 0 |
| 2015-16 | 1,232 -66 | 1,232 -66 | 581 -3 | 651 -63 | 0 0 | 0 0 | 0 0 |
| 2016-17 | 1,207 -25 | 1,207 -25 | 587 6 | 620 -31 | 0 0 | 0 0 | 0 0 |
| 2017-18 | 1,138 -69 | 1,138 -69 | 562 -25 | 576 -44 | 0 0 | 0 0 | 0 0 |
| 2018-19 | 1,262 124 | 1,262 124 | 614 52 | 648 72 | 0 0 | 0 0 | 0 0 |
| 2019-20 | 1,241 -21 | 1,241 -21 | 590 -24 | 651 3 | 0 0 | 0 0 | 0 0 |
| 2020-21 | 1,337 96 | 1,337 96 | 598 8 | 739 88 | 0 0 | 0 0 | 0 0 |
| 2021-22 | 1,294 -43 | 1,294 -43 | 589 -9 | 705 -34 | 0 0 | 0 0 | 0 0 |
| 2022-23 | 1,242 -52 | 1,242 -52 | 503 -86 | 739 34 | 0 0 | 0 0 | 0 0 |
| Average | 1,272 | 1,272 | 595 | 677 | |||