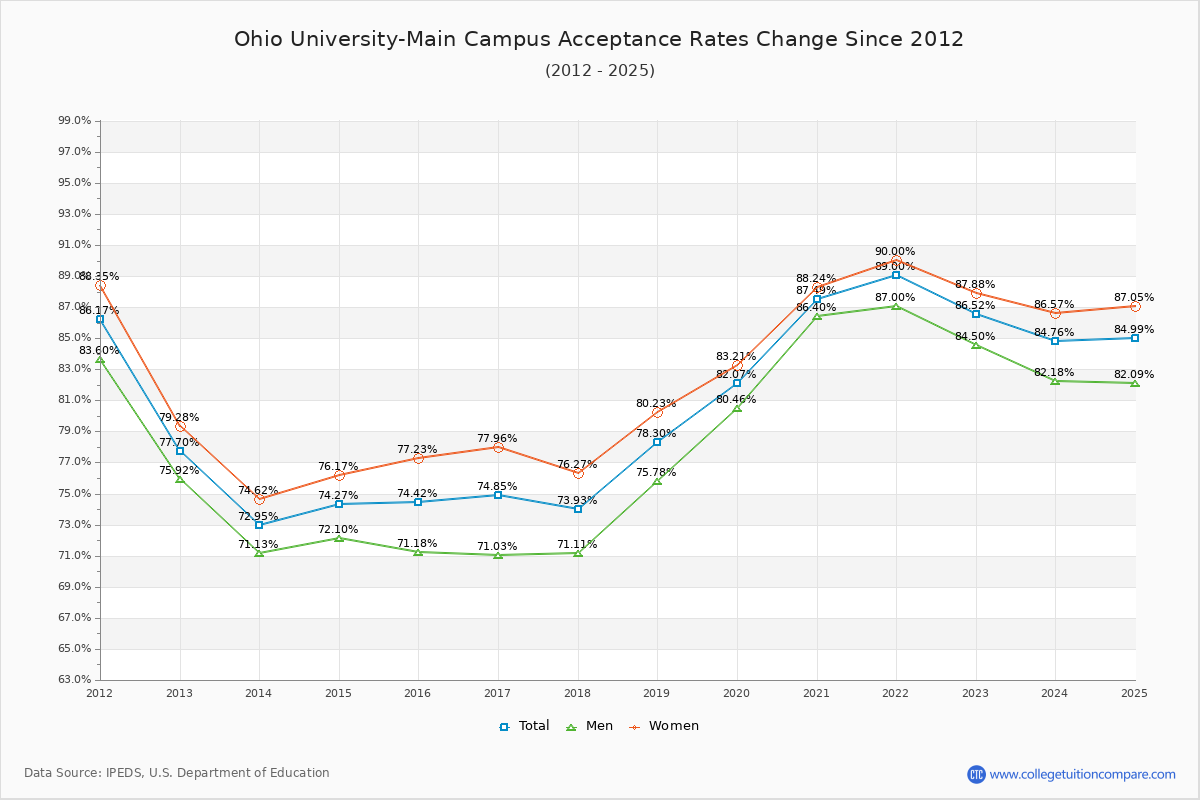
Acceptance Rate Changes
The average acceptance rate over the last 10 years is 79.23%, and this year's acceptance rate is 86.52% at Ohio University-Main Campus. By gender, men students' acceptance rate is 76.96% and women students' rate is 81.01%. For 2023 admission, it was slightly harder to get into Ohio University-Main Campus than the previous year.
The next table and chart illustrate the acceptance rates changes at Ohio University-Main Campus over the past 11 years (2012-2023).
| Year | Total | Men | Women |
|---|---|---|---|
| 2012-13 | 77.70% | 75.92% | 79.28% |
| 2013-14 | 72.95% -4.75% |
71.13% -4.67% |
74.62% -4.67% |
| 2014-15 | 74.27% 1.32% |
72.10% 1.56% |
76.17% 1.56% |
| 2015-16 | 74.42% 0.15% |
71.18% 1.06% |
77.23% 1.06% |
| 2016-17 | 74.85% 0.43% |
71.03% 0.73% |
77.96% 0.73% |
| 2017-18 | 73.93% -0.92% |
71.11% -1.69% |
76.27% -1.69% |
| 2018-19 | 78.30% 4.37% |
75.78% 3.96% |
80.23% 3.96% |
| 2019-20 | 82.07% 3.76% |
80.46% 2.99% |
83.21% 2.99% |
| 2020-21 | 87.49% 5.42% |
86.40% 5.03% |
88.24% 5.03% |
| 2021-22 | 89.00% 1.51% |
87.00% 1.76% |
90.00% 1.76% |
| 2022-23 | 86.52% -2.48% |
84.50% -2.12% |
87.88% -2.12% |
| Average | 79.23% | 76.96% | 81.01% |