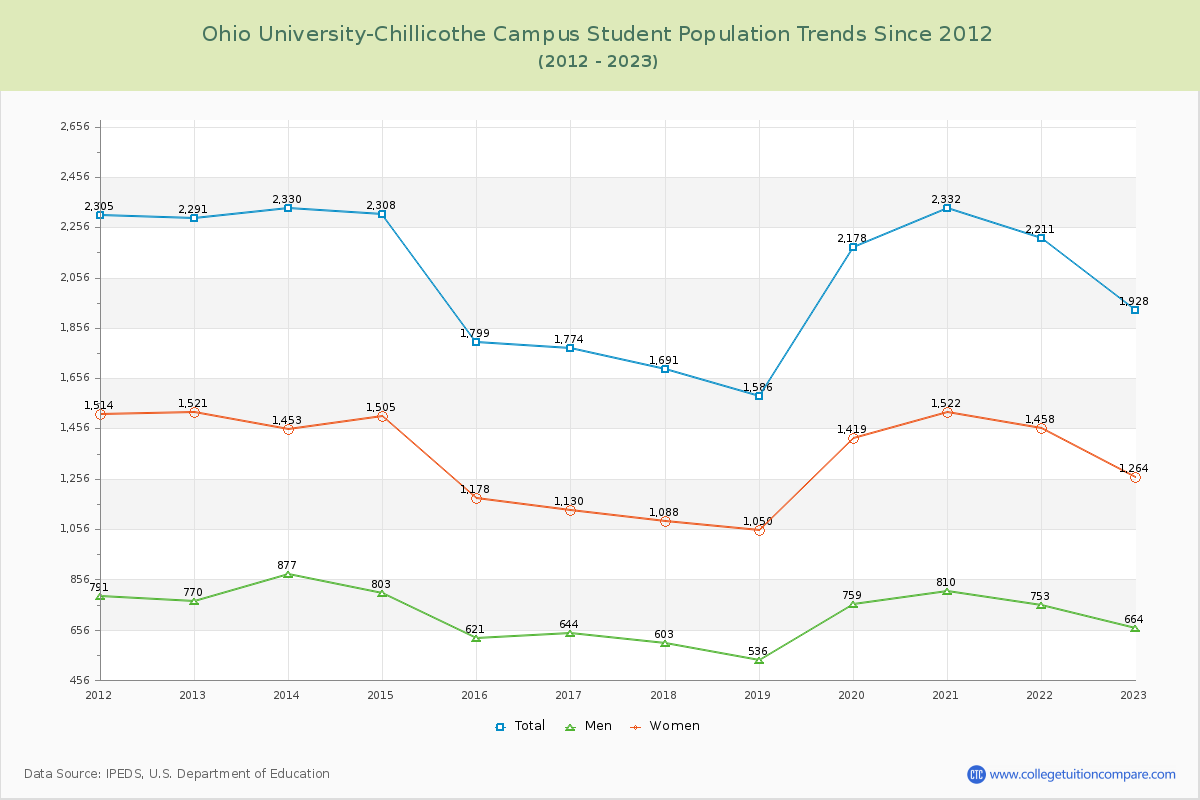
Student Population Changes
The average student population over the last 12 years is 2,039 where 1,928 students are attending the school for the academic year 2022-2023.
The female to male ratio is 1.90 to 1 and it means that there are more female students enrolled in Ohio University-Chillicothe Campus than male students.
The following table and chart illustrate the changes in student population by gender at Ohio University-Chillicothe Campus since 2012.
| Year | Total | Men | Women |
|---|---|---|---|
| 2012-13 | 2,291 | 770 | 1,521 |
| 2013-14 | 2,330 39 | 877 107 | 1,453 -68 |
| 2014-15 | 2,308 -22 | 803 -74 | 1,505 52 |
| 2015-16 | 1,799 -509 | 621 -182 | 1,178 -327 |
| 2016-17 | 1,774 -25 | 644 23 | 1,130 -48 |
| 2017-18 | 1,691 -83 | 603 -41 | 1,088 -42 |
| 2018-19 | 1,586 -105 | 536 -67 | 1,050 -38 |
| 2019-20 | 2,178 592 | 759 223 | 1,419 369 |
| 2020-21 | 2,332 154 | 810 51 | 1,522 103 |
| 2021-22 | 2,211 -121 | 753 -57 | 1,458 -64 |
| 2022-23 | 1,928 -283 | 664 -89 | 1,264 -194 |
| Average | 2,039 | 713 | 1,326 |