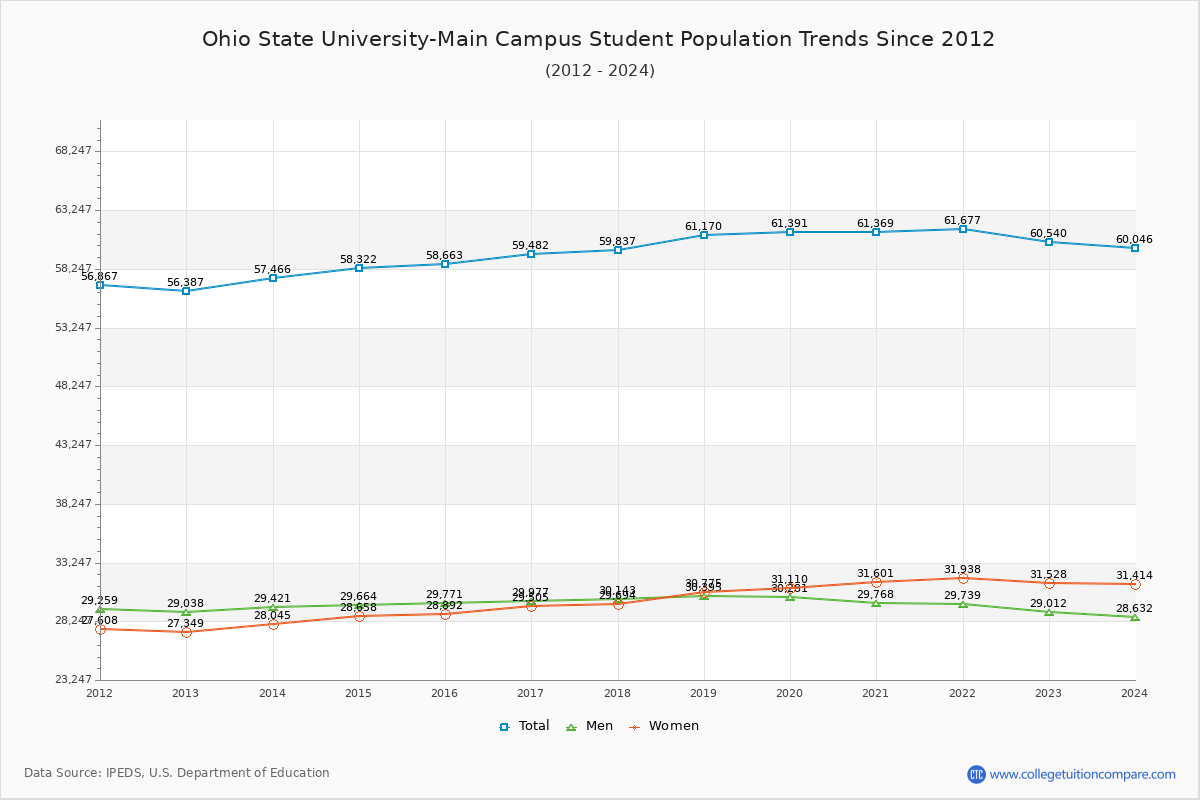
Student Population Changes
The average student population over the last 12 years is 59,664 where 60,540 students are attending the school for the academic year 2022-2023.
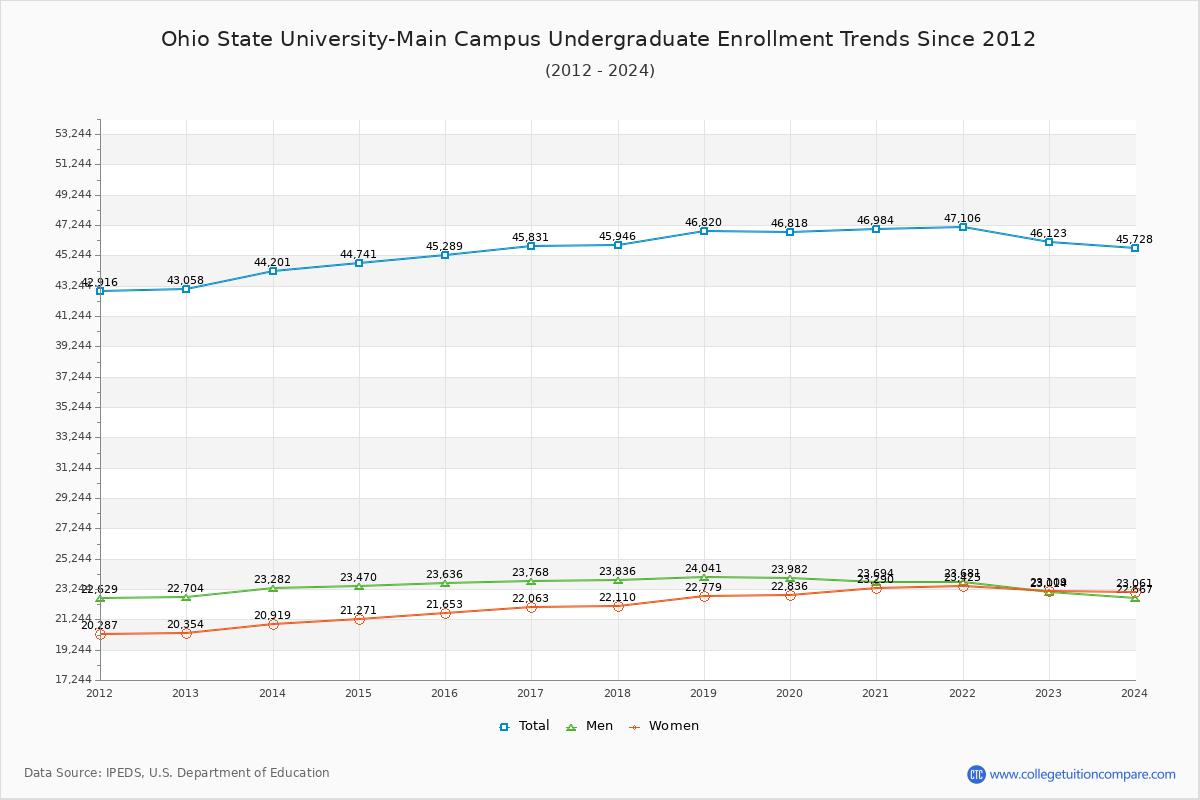
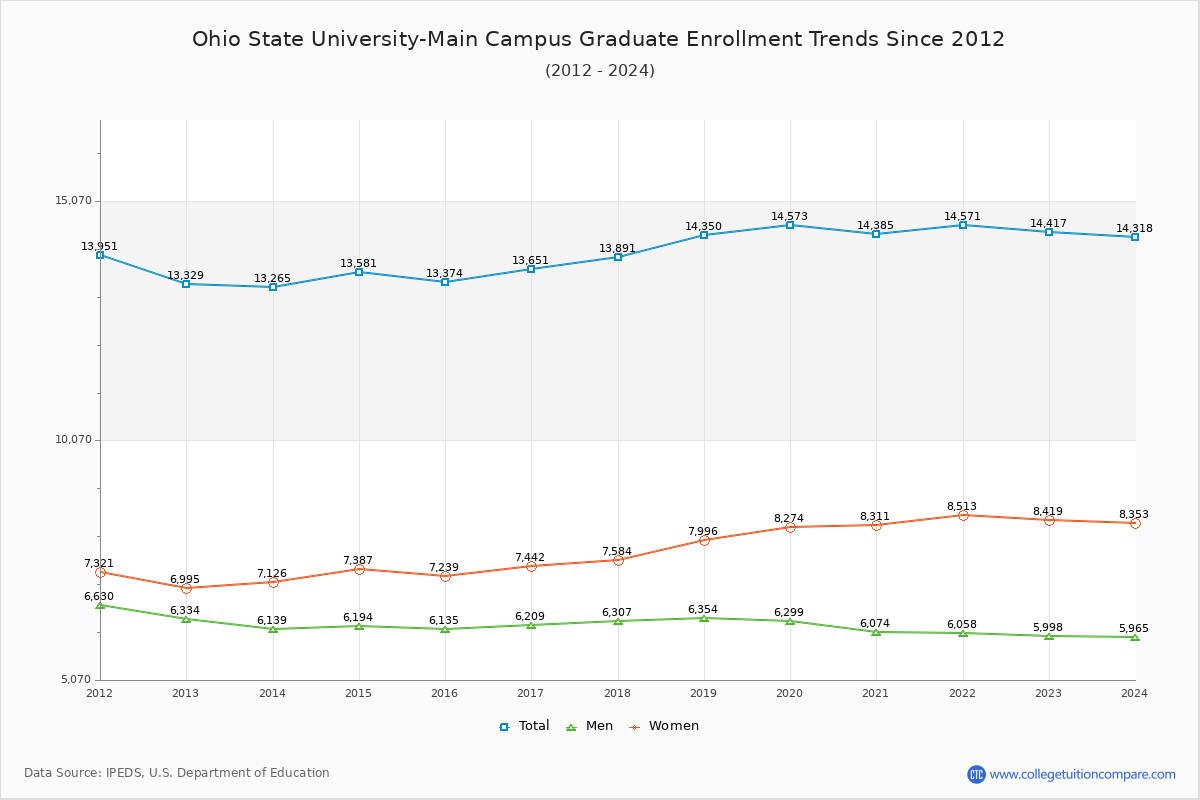
76.19% of total students is undergraduate students and 23.81% students is graduate students. The number of undergraduate students has increased by 3,065 and the graduate enrollment has increased by 1,088 over past 10 years.
The female to male ratio is 1.09 to 1 and it means that there are similar numbers of female and male students enrolled in OSU.
The following table and chart illustrate the changes in student population by gender at Ohio State University-Main Campus since 2012.
| Year | Total | Undergraduate | Graduate | ||||
|---|---|---|---|---|---|---|---|
| Total | Men | Women | Total | Men | Women | ||
| 2012-13 | 56,387 | 43,058 | 22,704 | 20,354 | 13,329 | 6,334 | 6,995 |
| 2013-14 | 57,466 1,079 | 44,201 1,143 | 23,282 578 | 20,919 565 | 13,265 -64 | 6,139 -195 | 7,126 131 |
| 2014-15 | 58,322 856 | 44,741 540 | 23,470 188 | 21,271 352 | 13,581 316 | 6,194 55 | 7,387 261 |
| 2015-16 | 58,663 341 | 45,289 548 | 23,636 166 | 21,653 382 | 13,374 -207 | 6,135 -59 | 7,239 -148 |
| 2016-17 | 59,482 819 | 45,831 542 | 23,768 132 | 22,063 410 | 13,651 277 | 6,209 74 | 7,442 203 |
| 2017-18 | 59,837 355 | 45,946 115 | 23,836 68 | 22,110 47 | 13,891 240 | 6,307 98 | 7,584 142 |
| 2018-19 | 61,170 1,333 | 46,820 874 | 24,041 205 | 22,779 669 | 14,350 459 | 6,354 47 | 7,996 412 |
| 2019-20 | 61,391 221 | 46,818 -2 | 23,982 -59 | 22,836 57 | 14,573 223 | 6,299 -55 | 8,274 278 |
| 2020-21 | 61,369 -22 | 46,984 166 | 23,694 -288 | 23,290 454 | 14,385 -188 | 6,074 -225 | 8,311 37 |
| 2021-22 | 61,677 308 | 47,106 122 | 23,681 -13 | 23,425 135 | 14,571 186 | 6,058 -16 | 8,513 202 |
| 2022-23 | 60,540 -1,137 | 46,123 -983 | 23,014 -667 | 23,109 -316 | 14,417 -154 | 5,998 -60 | 8,419 -94 |
| Average | 59,664 | 45,720 | 23,555 | 22,164 | 13,944 | 6,191 | 7,753 |