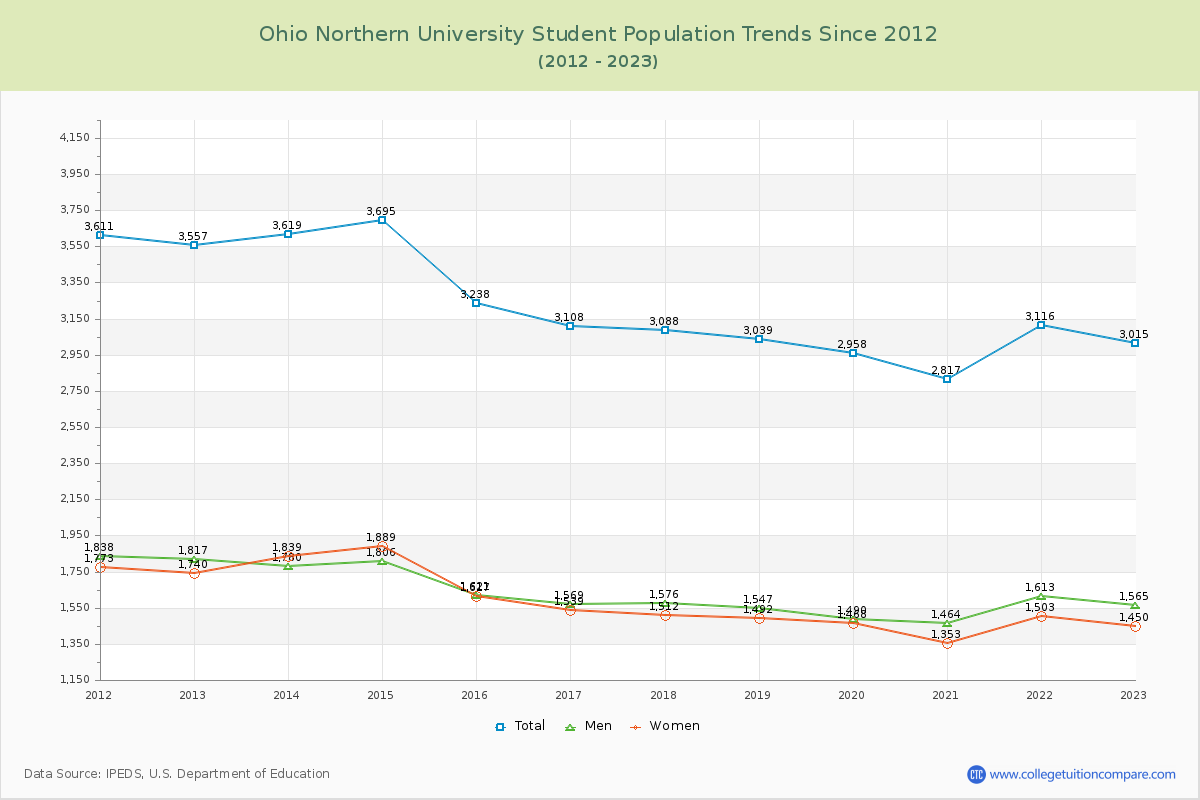
Student Population Changes
The average student population over the last 12 years is 3,205 where 3,015 students are attending the school for the academic year 2022-2023.
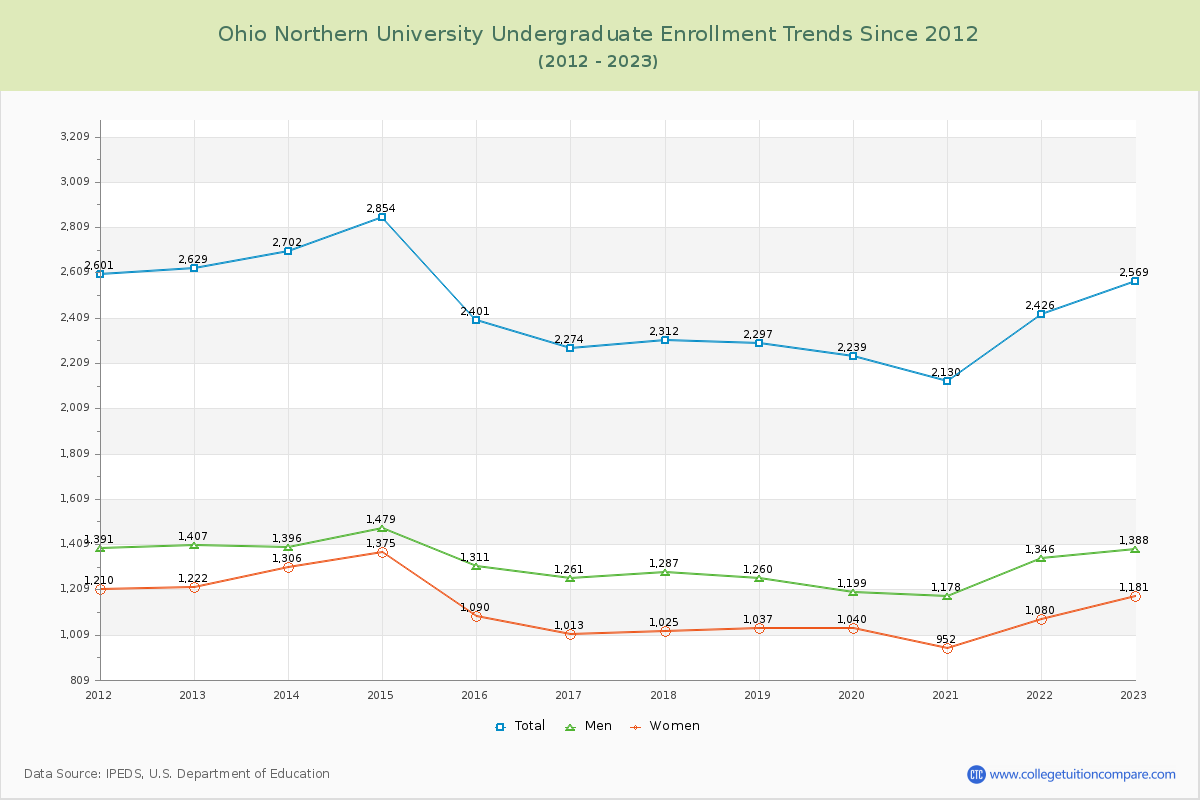
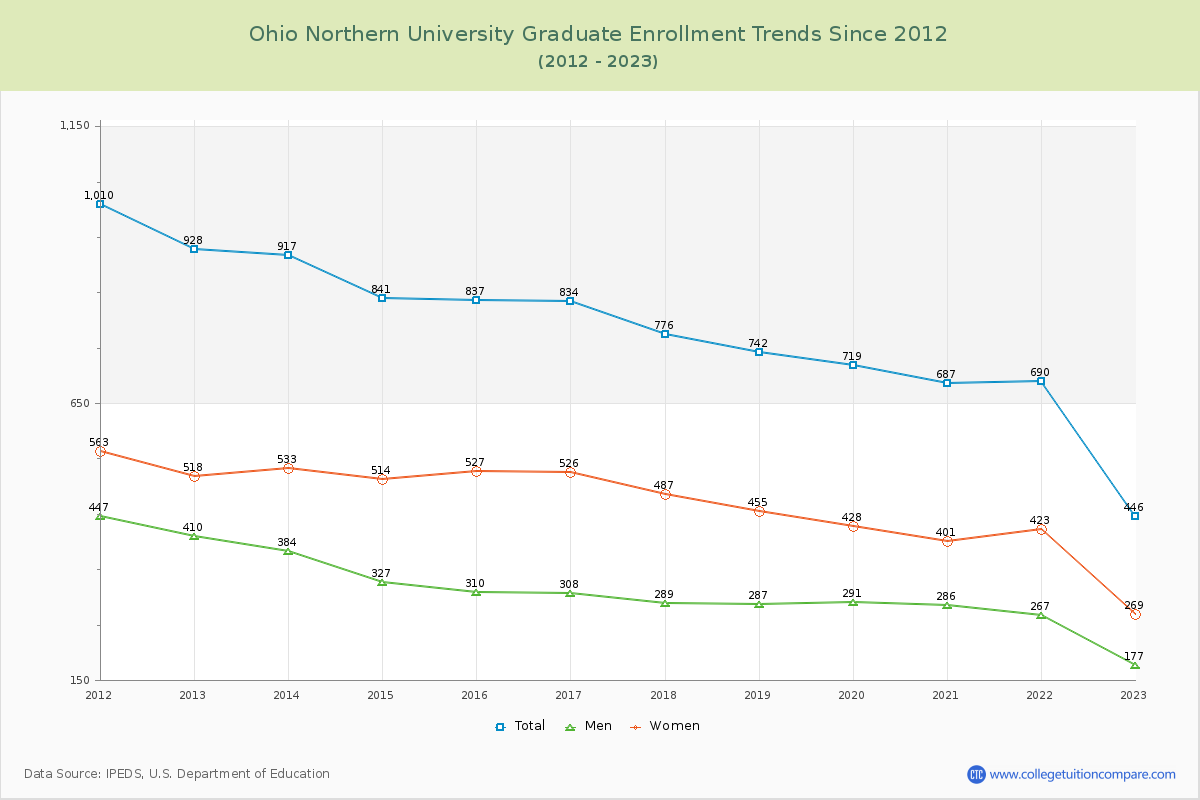
85.21% of total students is undergraduate students and 14.79% students is graduate students. The number of undergraduate students has decreased by 60 and the graduate enrollment has decreased by 482 over past 10 years.
The female to male ratio is 0.93 to 1 and it means that there are similar numbers of female and male students enrolled in ONU.
The following table and chart illustrate the changes in student population by gender at Ohio Northern University since 2012.
| Year | Total | Undergraduate | Graduate | ||||
|---|---|---|---|---|---|---|---|
| Total | Men | Women | Total | Men | Women | ||
| 2012-13 | 3,557 | 2,629 | 1,407 | 1,222 | 928 | 410 | 518 |
| 2013-14 | 3,619 62 | 2,702 73 | 1,396 -11 | 1,306 84 | 917 -11 | 384 -26 | 533 15 |
| 2014-15 | 3,695 76 | 2,854 152 | 1,479 83 | 1,375 69 | 841 -76 | 327 -57 | 514 -19 |
| 2015-16 | 3,238 -457 | 2,401 -453 | 1,311 -168 | 1,090 -285 | 837 -4 | 310 -17 | 527 13 |
| 2016-17 | 3,108 -130 | 2,274 -127 | 1,261 -50 | 1,013 -77 | 834 -3 | 308 -2 | 526 -1 |
| 2017-18 | 3,088 -20 | 2,312 38 | 1,287 26 | 1,025 12 | 776 -58 | 289 -19 | 487 -39 |
| 2018-19 | 3,039 -49 | 2,297 -15 | 1,260 -27 | 1,037 12 | 742 -34 | 287 -2 | 455 -32 |
| 2019-20 | 2,958 -81 | 2,239 -58 | 1,199 -61 | 1,040 3 | 719 -23 | 291 4 | 428 -27 |
| 2020-21 | 2,817 -141 | 2,130 -109 | 1,178 -21 | 952 -88 | 687 -32 | 286 -5 | 401 -27 |
| 2021-22 | 3,116 299 | 2,426 296 | 1,346 168 | 1,080 128 | 690 3 | 267 -19 | 423 22 |
| 2022-23 | 3,015 -101 | 2,569 143 | 1,388 42 | 1,181 101 | 446 -244 | 177 -90 | 269 -154 |
| Average | 3,205 | 2,439 | 1,319 | 1,120 | 765 | 303 | 462 |