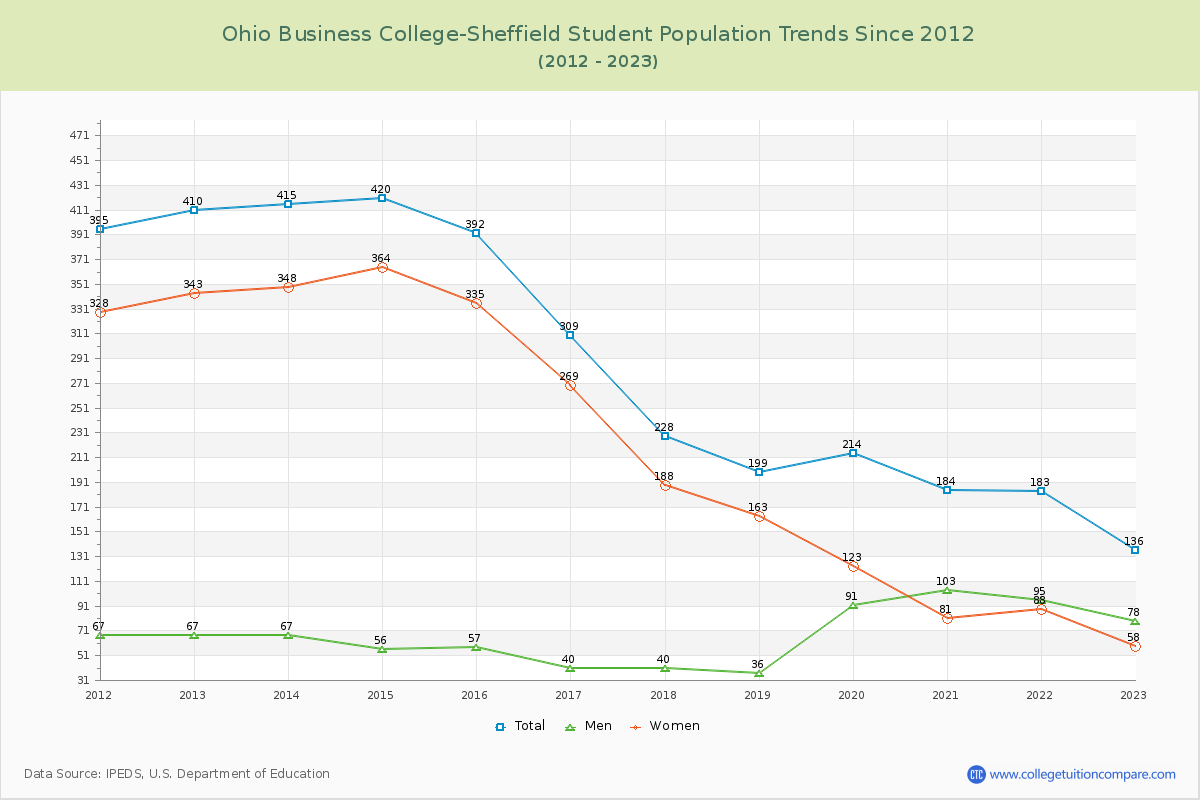
Student Population Changes
The average student population over the last 12 years is 281 where 136 students are attending the school for the academic year 2022-2023.
The female to male ratio is 0.74 to 1 and it means that there are more male students enrolled in Ohio Business College-Sheffield than female students.
The following table and chart illustrate the changes in student population by gender at Ohio Business College-Sheffield since 2012.
| Year | Total | Men | Women |
|---|---|---|---|
| 2012-13 | 410 | 67 | 343 |
| 2013-14 | 415 5 | 67 0 | 348 5 |
| 2014-15 | 420 5 | 56 -11 | 364 16 |
| 2015-16 | 392 -28 | 57 1 | 335 -29 |
| 2016-17 | 309 -83 | 40 -17 | 269 -66 |
| 2017-18 | 228 -81 | 40 0 | 188 -81 |
| 2018-19 | 199 -29 | 36 -4 | 163 -25 |
| 2019-20 | 214 15 | 91 55 | 123 -40 |
| 2020-21 | 184 -30 | 103 12 | 81 -42 |
| 2021-22 | 183 -1 | 95 -8 | 88 7 |
| 2022-23 | 136 -47 | 78 -17 | 58 -30 |
| Average | 281 | 66 | 215 |