Student Population Changes

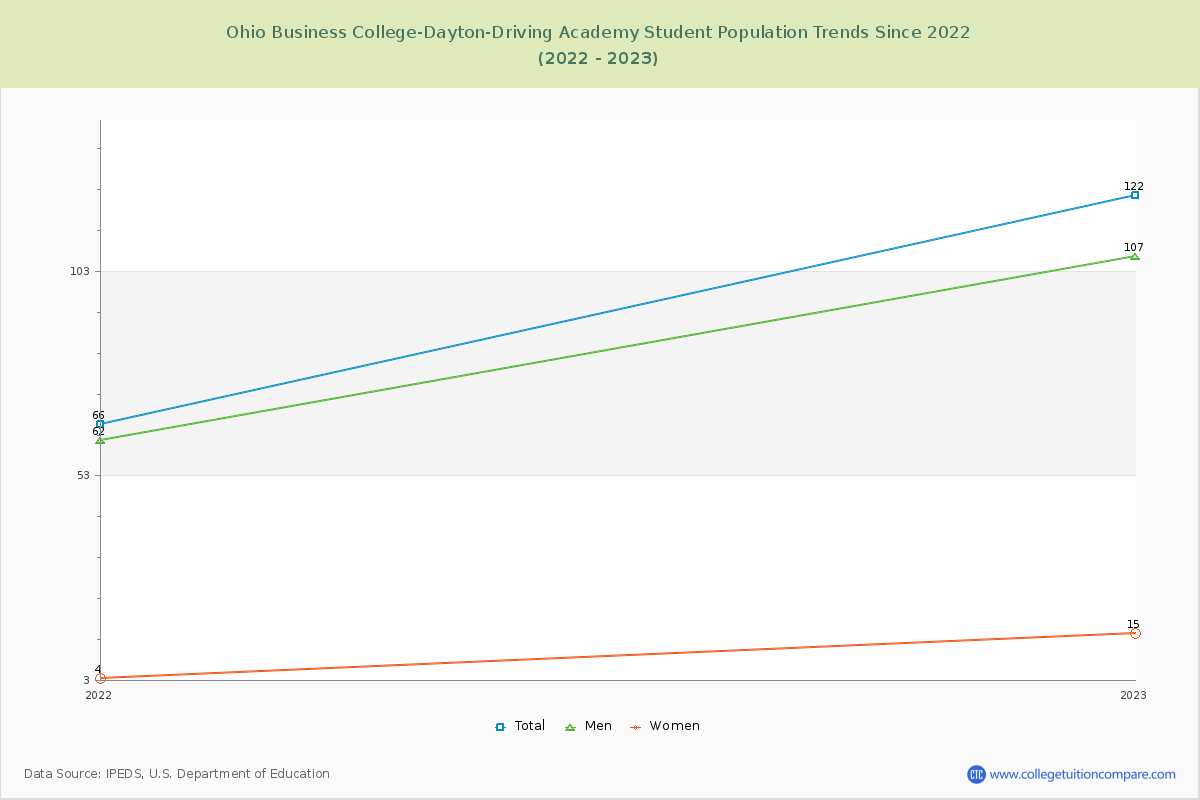
The average student population over the last 3 years is 94 where 122 students are attending the school for the academic year 2022-2023.
The female to male ratio is 0.14 to 1 and it means that there are far more male students enrolled in Ohio Business College-Dayton-Driving Academy than female students.
The following table and chart illustrate the changes in student population by gender at Ohio Business College-Dayton-Driving Academy since 2021.
TableInteractive ChartDownloadable Chart
Student Population Changes of Ohio Business College-Dayton-Driving Academy
Ohio Business College-Dayton-Driving Academy Enrollment Trends Chart

Enrollment by Race/Ethnicity Changes

The percentage of white students is 35.25% and the percentage of black students is 57.38% at Ohio Business College-Dayton-Driving Academy. 2.46% of enrolled students is Asian.
The following table and chart illustrate the student population trends by race/ethnicity at Ohio Business College-Dayton-Driving Academy over the past 3 years (2021-2023).
TableInteractive ChartDownloadable Chart
Enrollment by Race/Ethnicity Changes of Ohio Business College-Dayton-Driving Academy
Ohio Business College-Dayton-Driving Academy Enrollment by Race Trends Chart

Distance Learning (Online Courses) Enrollment Changes

Ohio Business College-Dayton-Driving Academy does not offer online degree/certificate programs. All Students have enrolled in on-campus programs.

Compare Ohio Business College-Dayton-Driving Academy in a Variety of Ways

Related Articles and Ads