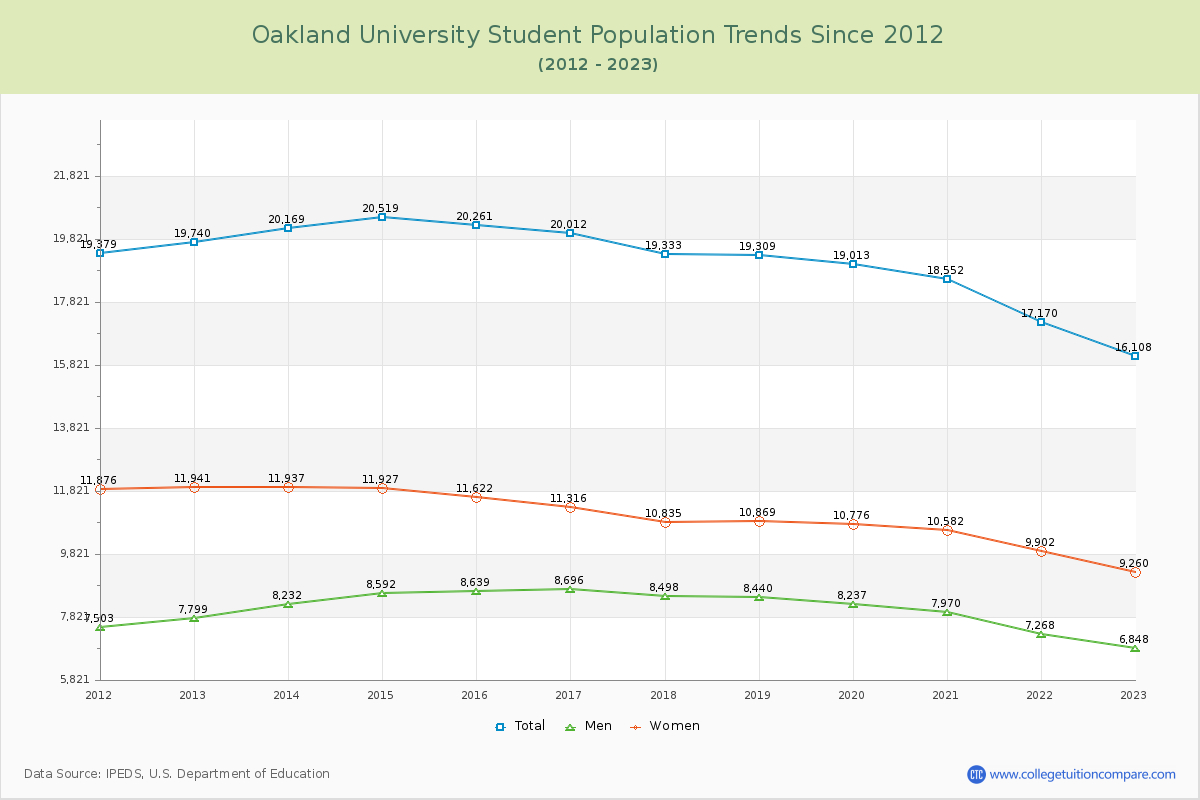
Student Population Changes
The average student population over the last 12 years is 19,108 where 16,108 students are attending the school for the academic year 2022-2023.
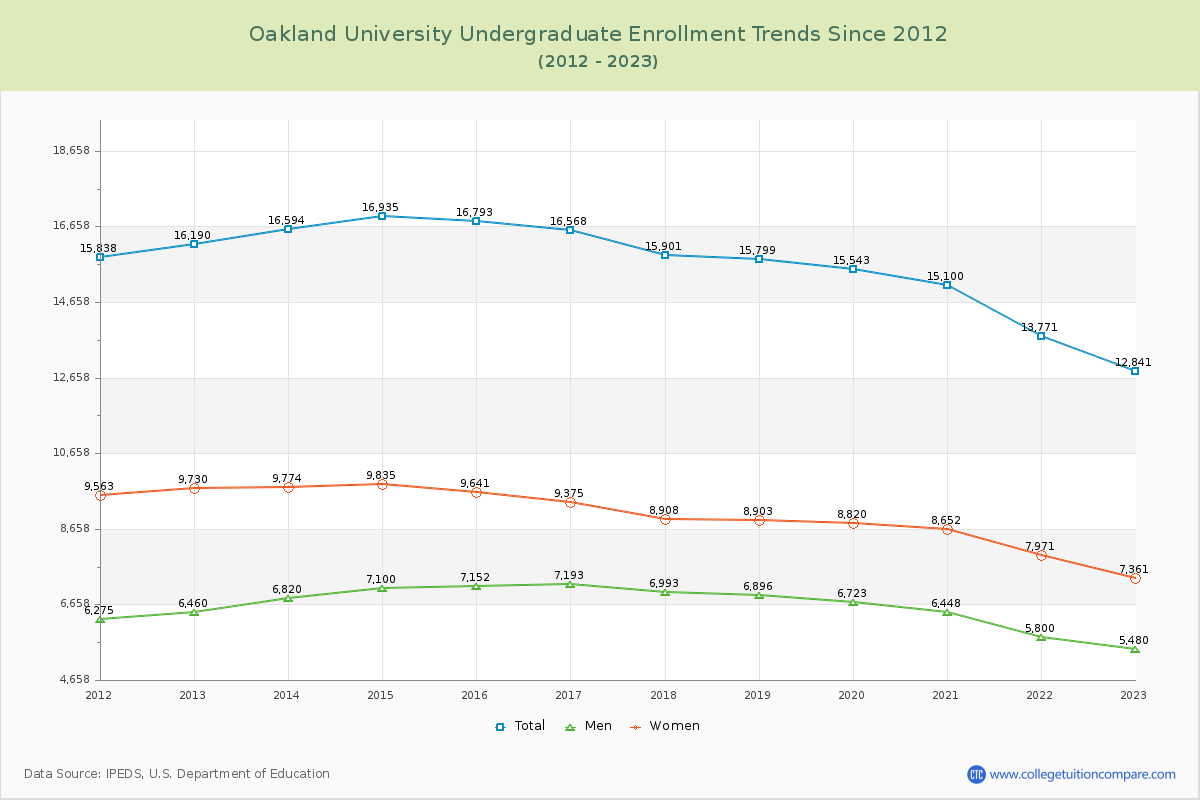
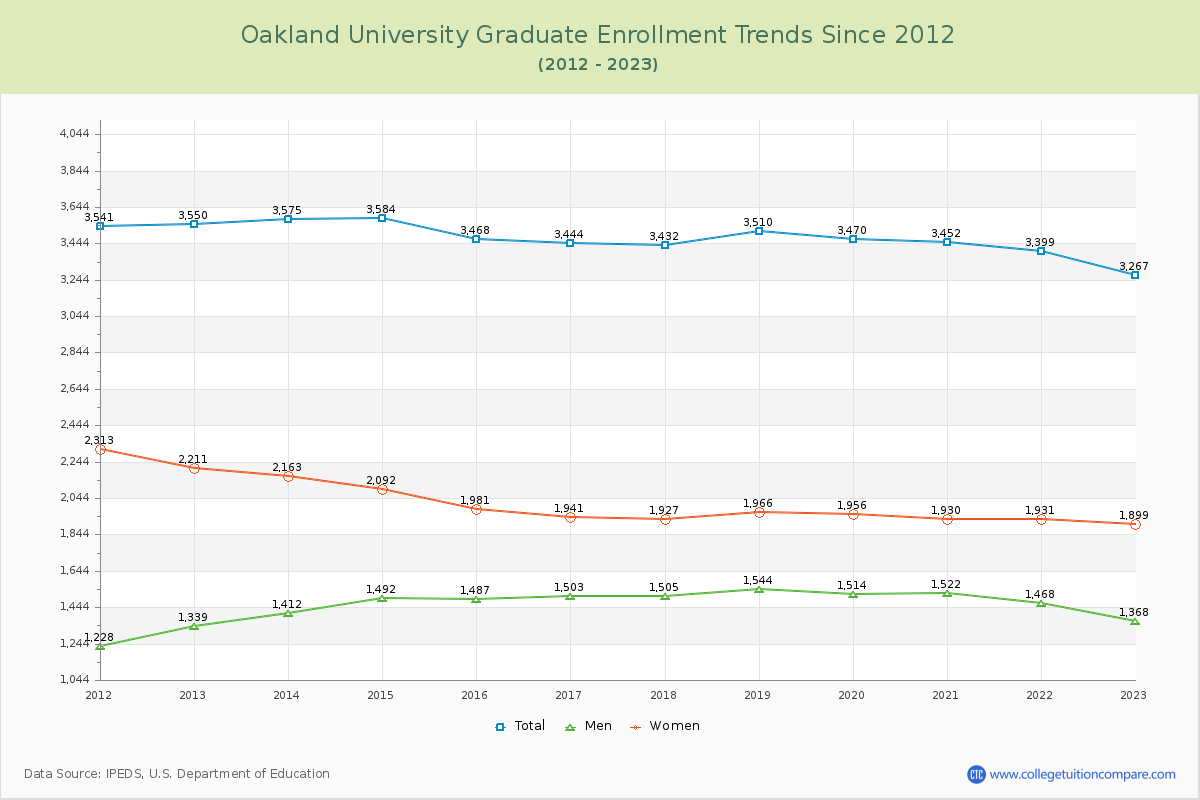
79.72% of total students is undergraduate students and 20.28% students is graduate students. The number of undergraduate students has decreased by 3,349 and the graduate enrollment has decreased by 283 over past 10 years.
The female to male ratio is 1.35 to 1 and it means that there are more female students enrolled in OU than male students.
The following table and chart illustrate the changes in student population by gender at Oakland University since 2012.
| Year | Total | Undergraduate | Graduate | ||||
|---|---|---|---|---|---|---|---|
| Total | Men | Women | Total | Men | Women | ||
| 2012-13 | 19,740 | 16,190 | 6,460 | 9,730 | 3,550 | 1,339 | 2,211 |
| 2013-14 | 20,169 429 | 16,594 404 | 6,820 360 | 9,774 44 | 3,575 25 | 1,412 73 | 2,163 -48 |
| 2014-15 | 20,519 350 | 16,935 341 | 7,100 280 | 9,835 61 | 3,584 9 | 1,492 80 | 2,092 -71 |
| 2015-16 | 20,261 -258 | 16,793 -142 | 7,152 52 | 9,641 -194 | 3,468 -116 | 1,487 -5 | 1,981 -111 |
| 2016-17 | 20,012 -249 | 16,568 -225 | 7,193 41 | 9,375 -266 | 3,444 -24 | 1,503 16 | 1,941 -40 |
| 2017-18 | 19,333 -679 | 15,901 -667 | 6,993 -200 | 8,908 -467 | 3,432 -12 | 1,505 2 | 1,927 -14 |
| 2018-19 | 19,309 -24 | 15,799 -102 | 6,896 -97 | 8,903 -5 | 3,510 78 | 1,544 39 | 1,966 39 |
| 2019-20 | 19,013 -296 | 15,543 -256 | 6,723 -173 | 8,820 -83 | 3,470 -40 | 1,514 -30 | 1,956 -10 |
| 2020-21 | 18,552 -461 | 15,100 -443 | 6,448 -275 | 8,652 -168 | 3,452 -18 | 1,522 8 | 1,930 -26 |
| 2021-22 | 17,170 -1,382 | 13,771 -1,329 | 5,800 -648 | 7,971 -681 | 3,399 -53 | 1,468 -54 | 1,931 1 |
| 2022-23 | 16,108 -1,062 | 12,841 -930 | 5,480 -320 | 7,361 -610 | 3,267 -132 | 1,368 -100 | 1,899 -32 |
| Average | 19,108 | 15,640 | 6,642 | 8,997 | 3,468 | 1,469 | 2,000 |