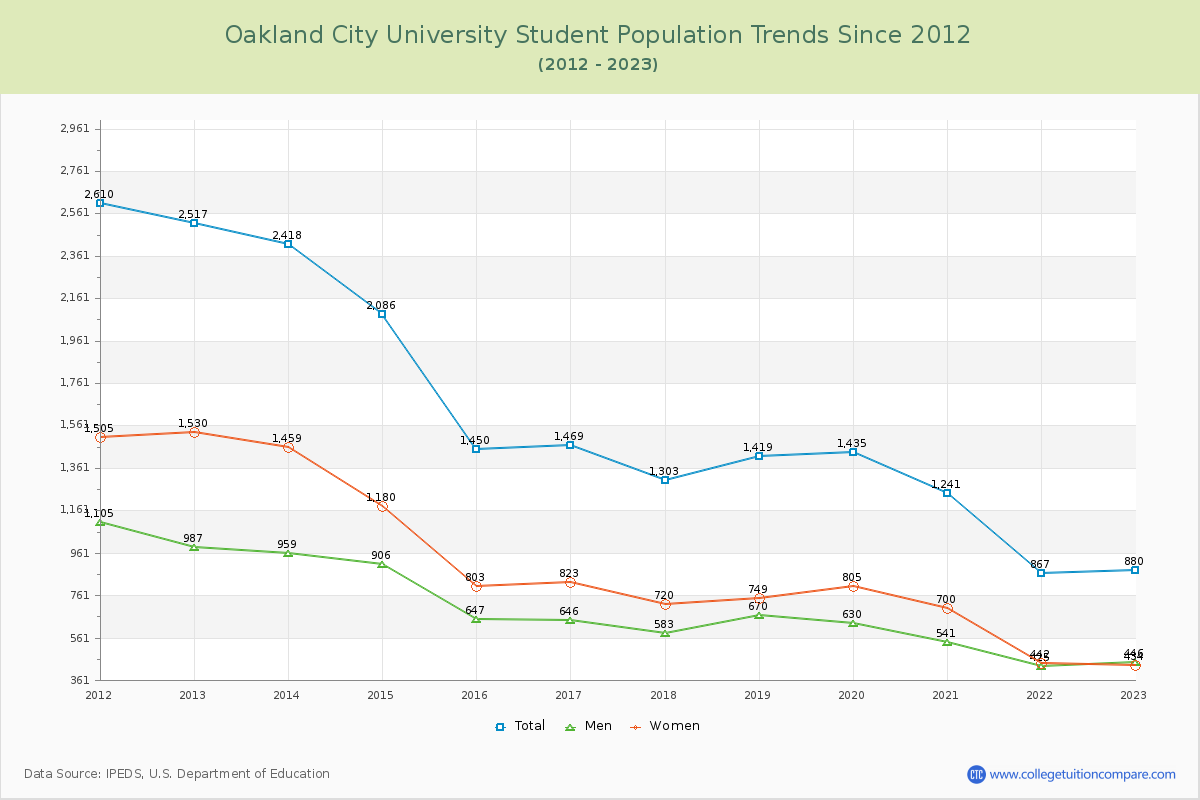
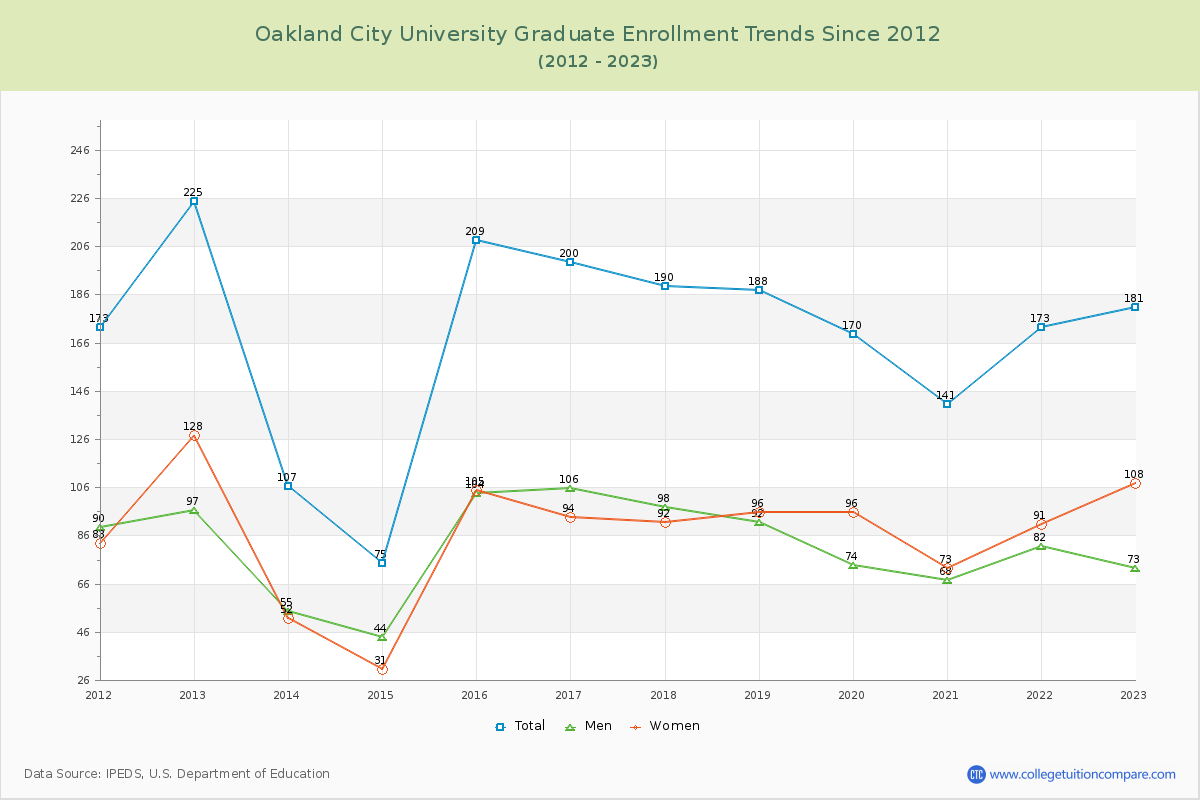
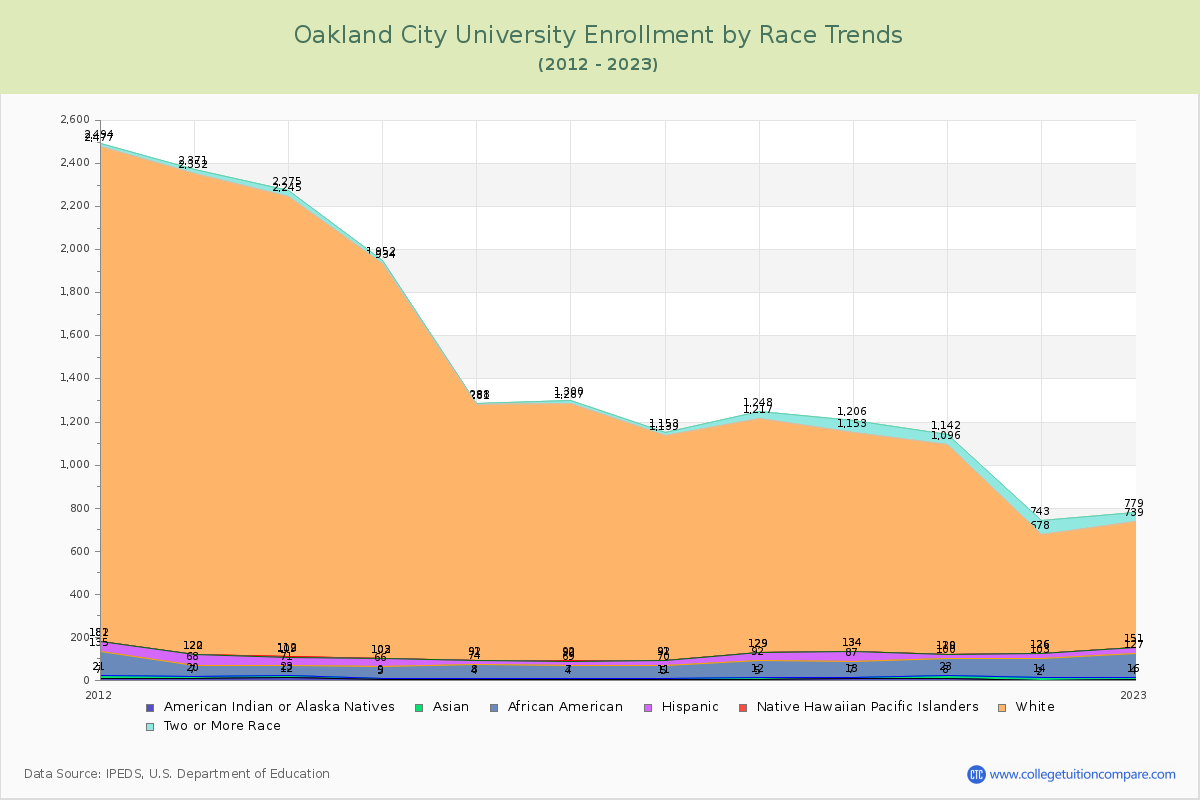
Student Population Changes
The average student population over the last 12 years is 1,553 where 880 students are attending the school for the academic year 2022-2023.
79.43% of total students is undergraduate students and 20.57% students is graduate students. The number of undergraduate students has decreased by 1,593 and the graduate enrollment has decreased by 44 over past 10 years.
The female to male ratio is 0.97 to 1 and it means that there are similar numbers of female and male students enrolled in Oakland City.
The following table and chart illustrate the changes in student population by gender at Oakland City University since 2012.
| Year | Total | Undergraduate | Graduate | ||||
|---|---|---|---|---|---|---|---|
| Total | Men | Women | Total | Men | Women | ||
| 2012-13 | 2,517 | 2,292 | 890 | 1,402 | 225 | 97 | 128 |
| 2013-14 | 2,418 -99 | 2,311 19 | 904 14 | 1,407 5 | 107 -118 | 55 -42 | 52 -76 |
| 2014-15 | 2,086 -332 | 2,011 -300 | 862 -42 | 1,149 -258 | 75 -32 | 44 -11 | 31 -21 |
| 2015-16 | 1,450 -636 | 1,241 -770 | 543 -319 | 698 -451 | 209 134 | 104 60 | 105 74 |
| 2016-17 | 1,469 19 | 1,269 28 | 540 -3 | 729 31 | 200 -9 | 106 2 | 94 -11 |
| 2017-18 | 1,303 -166 | 1,113 -156 | 485 -55 | 628 -101 | 190 -10 | 98 -8 | 92 -2 |
| 2018-19 | 1,419 116 | 1,231 118 | 578 93 | 653 25 | 188 -2 | 92 -6 | 96 4 |
| 2019-20 | 1,435 16 | 1,265 34 | 556 -22 | 709 56 | 170 -18 | 74 -18 | 96 0 |
| 2020-21 | 1,241 -194 | 1,100 -165 | 473 -83 | 627 -82 | 141 -29 | 68 -6 | 73 -23 |
| 2021-22 | 867 -374 | 694 -406 | 343 -130 | 351 -276 | 173 32 | 82 14 | 91 18 |
| 2022-23 | 880 13 | 699 5 | 373 30 | 326 -25 | 181 8 | 73 -9 | 108 17 |
| Average | 1,553 | 1,384 | 595 | 789 | 169 | 81 | 88 |