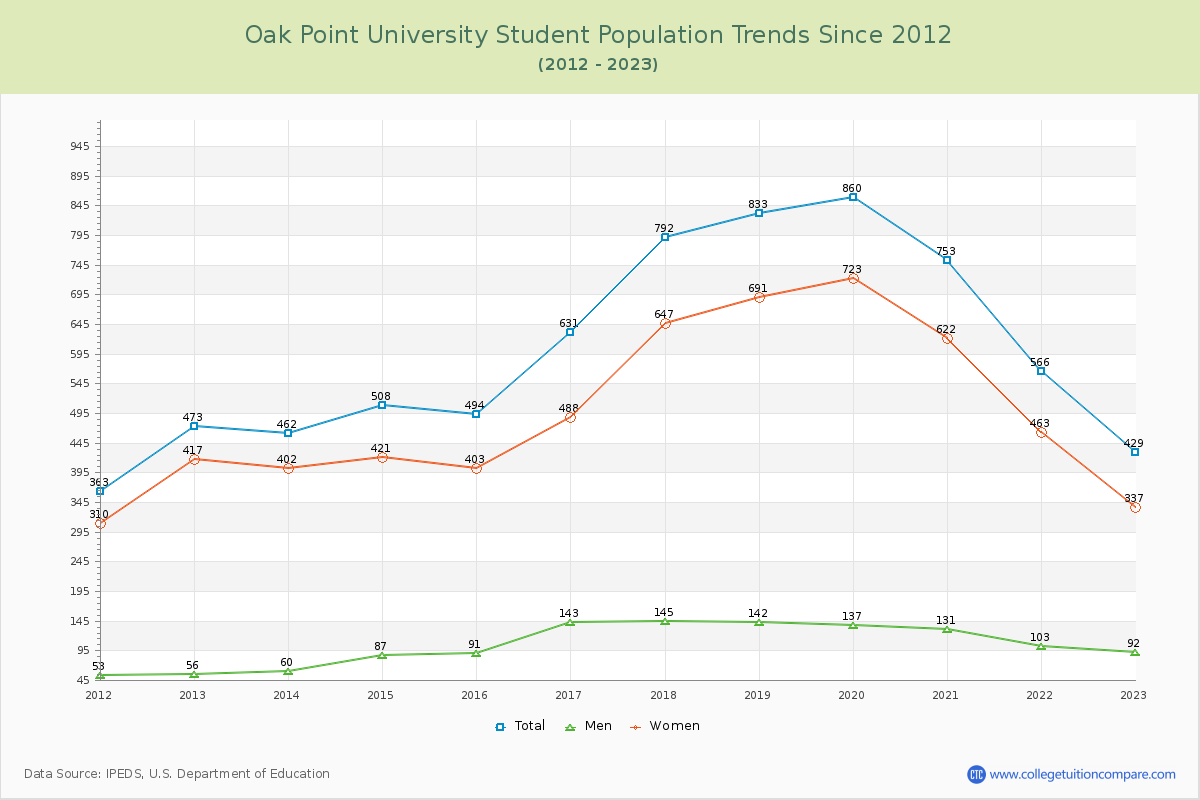
Student Population Changes
The average student population over the last 12 years is 618 where 429 students are attending the school for the academic year 2022-2023.
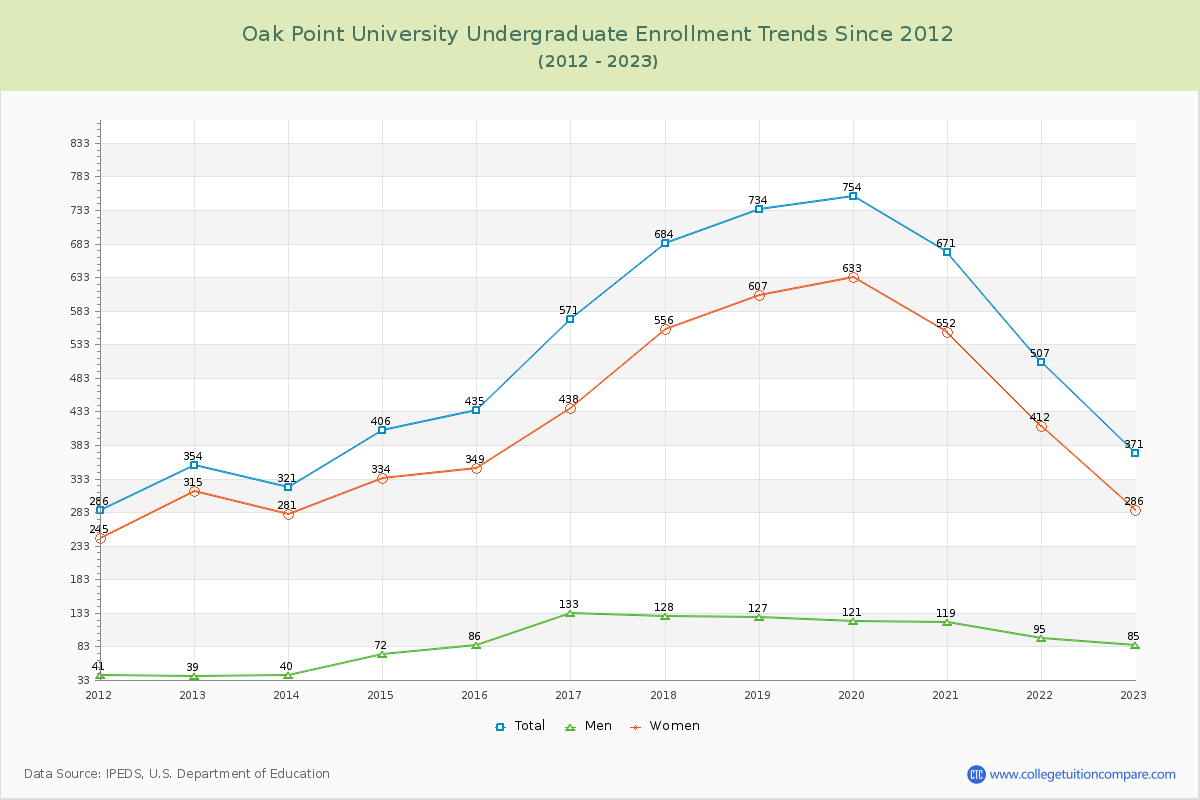
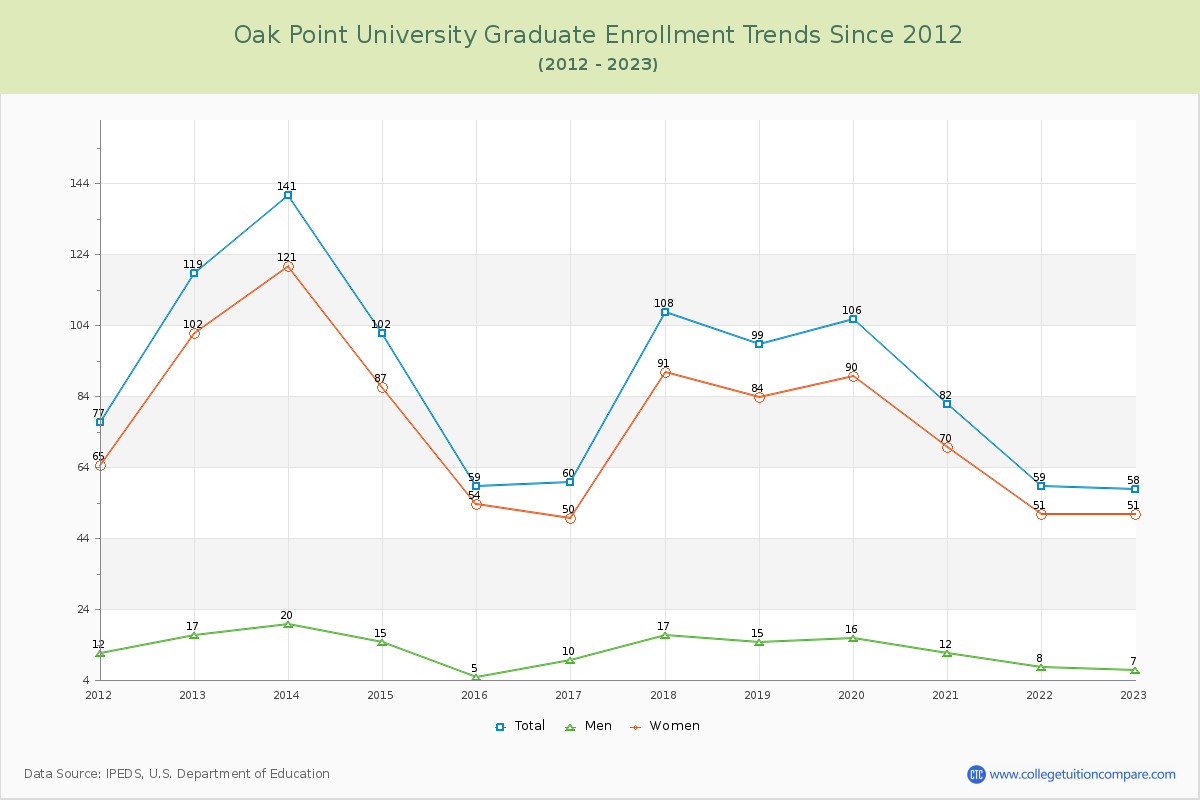
86.48% of total students is undergraduate students and 13.52% students is graduate students. The number of undergraduate students has increased by 17 and the graduate enrollment has decreased by 61 over past 10 years.
The female to male ratio is 3.66 to 1 and it means that there are far more female students enrolled in Oak Point than male students.
The following table and chart illustrate the changes in student population by gender at Oak Point University since 2012.
| Year | Total | Undergraduate | Graduate | ||||
|---|---|---|---|---|---|---|---|
| Total | Men | Women | Total | Men | Women | ||
| 2012-13 | 473 | 354 | 39 | 315 | 119 | 17 | 102 |
| 2013-14 | 462 -11 | 321 -33 | 40 1 | 281 -34 | 141 22 | 20 3 | 121 19 |
| 2014-15 | 508 46 | 406 85 | 72 32 | 334 53 | 102 -39 | 15 -5 | 87 -34 |
| 2015-16 | 494 -14 | 435 29 | 86 14 | 349 15 | 59 -43 | 5 -10 | 54 -33 |
| 2016-17 | 631 137 | 571 136 | 133 47 | 438 89 | 60 1 | 10 5 | 50 -4 |
| 2017-18 | 792 161 | 684 113 | 128 -5 | 556 118 | 108 48 | 17 7 | 91 41 |
| 2018-19 | 833 41 | 734 50 | 127 -1 | 607 51 | 99 -9 | 15 -2 | 84 -7 |
| 2019-20 | 860 27 | 754 20 | 121 -6 | 633 26 | 106 7 | 16 1 | 90 6 |
| 2020-21 | 753 -107 | 671 -83 | 119 -2 | 552 -81 | 82 -24 | 12 -4 | 70 -20 |
| 2021-22 | 566 -187 | 507 -164 | 95 -24 | 412 -140 | 59 -23 | 8 -4 | 51 -19 |
| 2022-23 | 429 -137 | 371 -136 | 85 -10 | 286 -126 | 58 -1 | 7 -1 | 51 0 |
| Average | 618 | 528 | 95 | 433 | 90 | 13 | 77 |