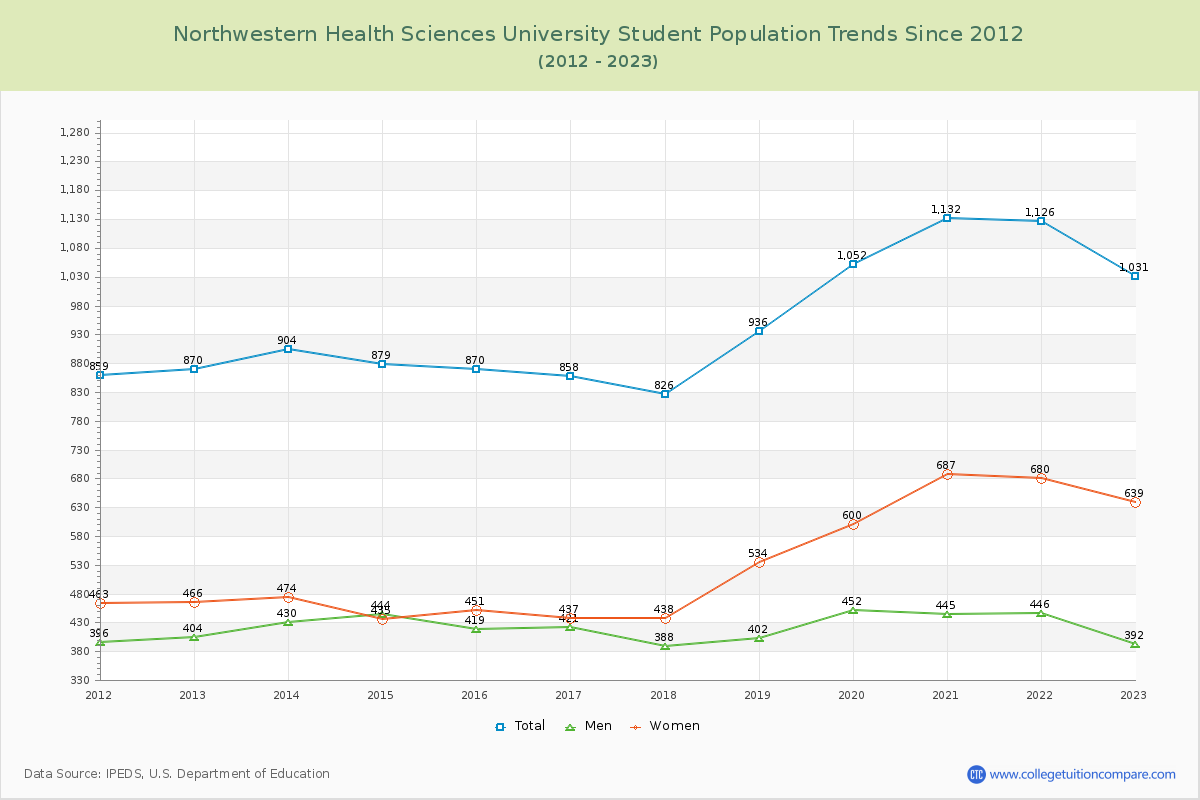
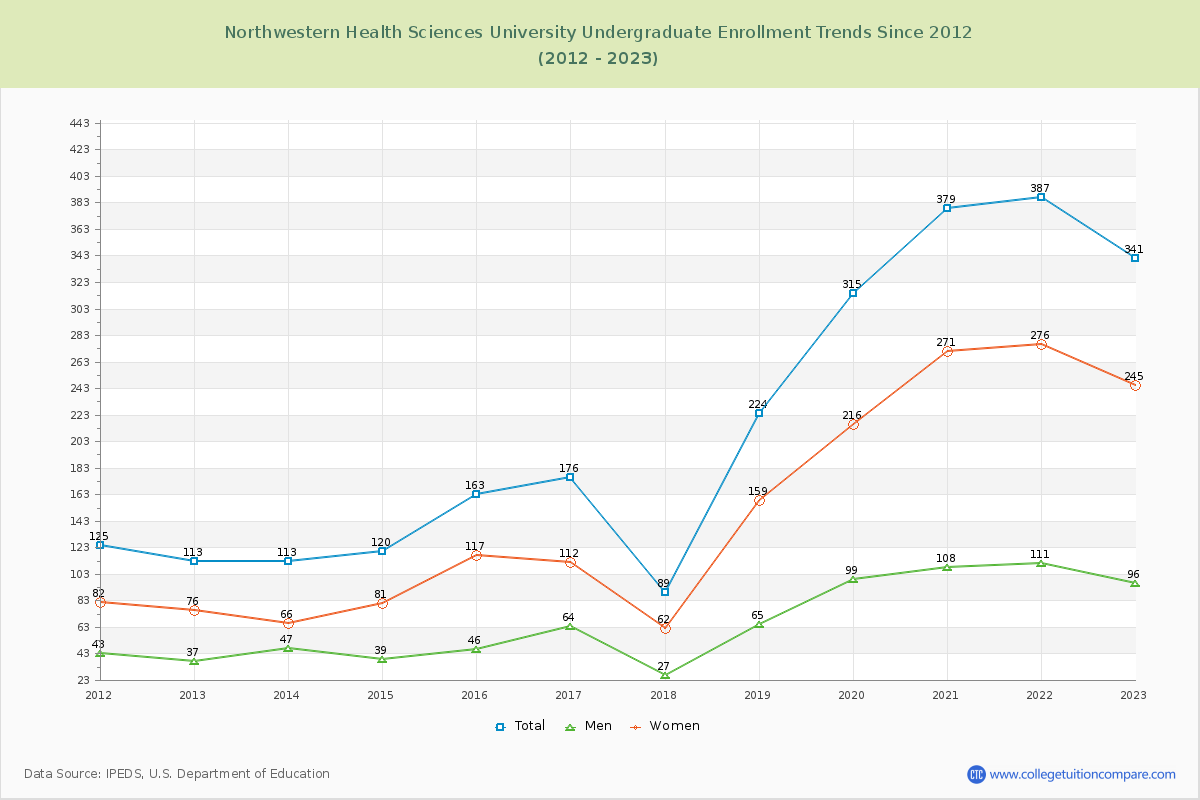
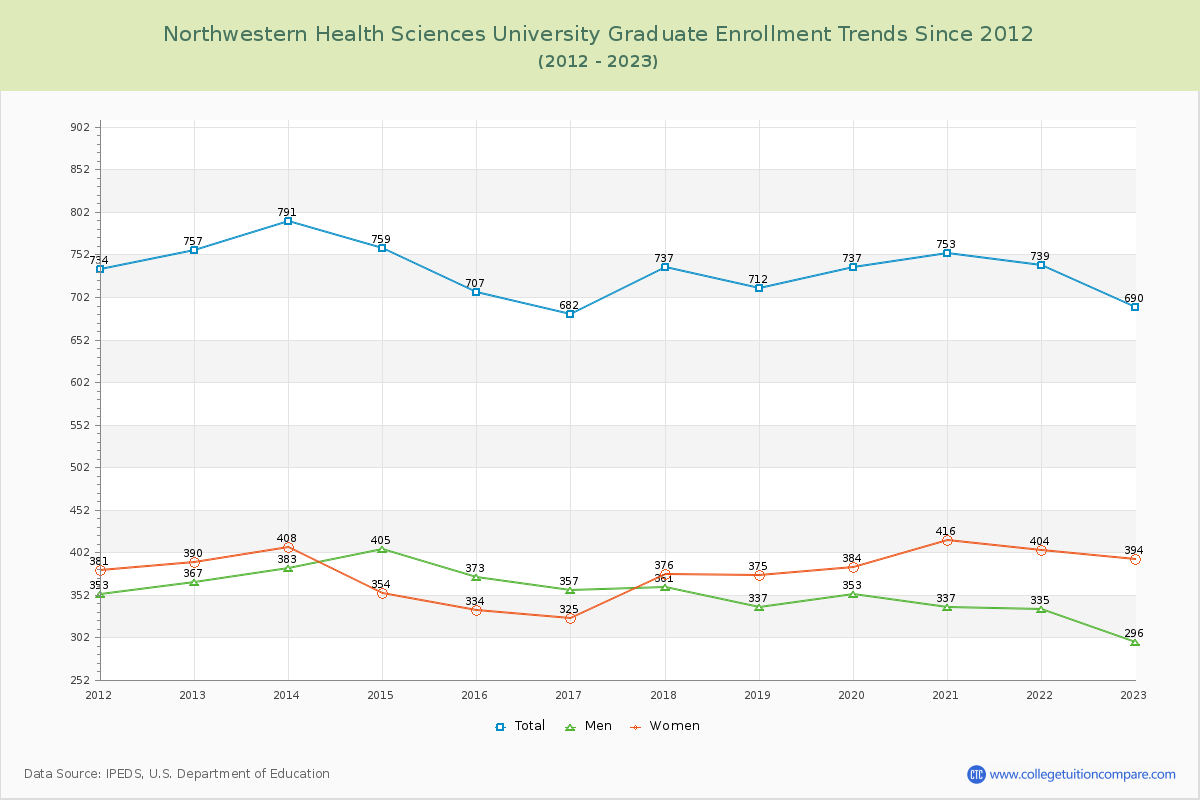
Student Population Changes
The average student population over the last 12 years is 953 where 1,031 students are attending the school for the academic year 2022-2023.
33.07% of total students is undergraduate students and 66.93% students is graduate students. The number of undergraduate students has increased by 228 and the graduate enrollment has decreased by 67 over past 10 years.
The female to male ratio is 1.63 to 1 and it means that there are more female students enrolled in Northwestern Health Sciences than male students.
The following table and chart illustrate the changes in student population by gender at Northwestern Health Sciences University since 2012.
| Year | Total | Undergraduate | Graduate | ||||
|---|---|---|---|---|---|---|---|
| Total | Men | Women | Total | Men | Women | ||
| 2012-13 | 870 | 113 | 37 | 76 | 757 | 367 | 390 |
| 2013-14 | 904 34 | 113 0 | 47 10 | 66 -10 | 791 34 | 383 16 | 408 18 |
| 2014-15 | 879 -25 | 120 7 | 39 -8 | 81 15 | 759 -32 | 405 22 | 354 -54 |
| 2015-16 | 870 -9 | 163 43 | 46 7 | 117 36 | 707 -52 | 373 -32 | 334 -20 |
| 2016-17 | 858 -12 | 176 13 | 64 18 | 112 -5 | 682 -25 | 357 -16 | 325 -9 |
| 2017-18 | 826 -32 | 89 -87 | 27 -37 | 62 -50 | 737 55 | 361 4 | 376 51 |
| 2018-19 | 936 110 | 224 135 | 65 38 | 159 97 | 712 -25 | 337 -24 | 375 -1 |
| 2019-20 | 1,052 116 | 315 91 | 99 34 | 216 57 | 737 25 | 353 16 | 384 9 |
| 2020-21 | 1,132 80 | 379 64 | 108 9 | 271 55 | 753 16 | 337 -16 | 416 32 |
| 2021-22 | 1,126 -6 | 387 8 | 111 3 | 276 5 | 739 -14 | 335 -2 | 404 -12 |
| 2022-23 | 1,031 -95 | 341 -46 | 96 -15 | 245 -31 | 690 -49 | 296 -39 | 394 -10 |
| Average | 953 | 220 | 67 | 153 | 733 | 355 | 378 |